
- Home >
- Stock Photos >
- Financial Dashboard with Trend Lines and Bar Chart Analysis
Financial Dashboard with Trend Lines and Bar Chart Analysis Image
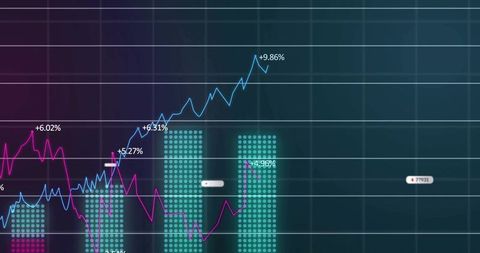
Image displays an advanced financial dashboard featuring vibrant sky-blue and magenta trend lines with percentage increase labels, alongside complementing teal bar charts. Perfect for illustrating financial growth and data analytics, this graphic suits presentations, business strategies, finance reports, and technology infographics highlighting investment trends, market analysis, or corporate performance.
Powered by 


0
downloads
downloads
Tags:
More
Credit Photo
If you would like to credit the Photo, here are some ways you can do so
Text Link
photo Link
<span class="text-link">
<span>
<a target="_blank" href=https://pikwizard.com/photo/financial-dashboard-with-trend-lines-and-bar-chart-analysis/7465a45a285bb5e9692ccf5c5ddf6be9/>PikWizard</a>
</span>
</span>
<span class="image-link">
<span
style="margin: 0 0 20px 0; display: inline-block; vertical-align: middle; width: 100%;"
>
<a
target="_blank"
href="https://pikwizard.com/photo/financial-dashboard-with-trend-lines-and-bar-chart-analysis/7465a45a285bb5e9692ccf5c5ddf6be9/"
style="text-decoration: none; font-size: 10px; margin: 0;"
>
<img src="https://pikwizard.com/pw/medium/7465a45a285bb5e9692ccf5c5ddf6be9.jpg" style="margin: 0; width: 100%;" alt="" />
<p style="font-size: 12px; margin: 0;">PikWizard</p>
</a>
</span>
</span>
Free (free of charge)
Free for personal and commercial use.
Author: Authentic Images