
- Home >
- Stock Photos >
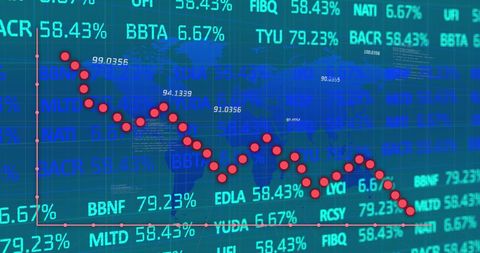
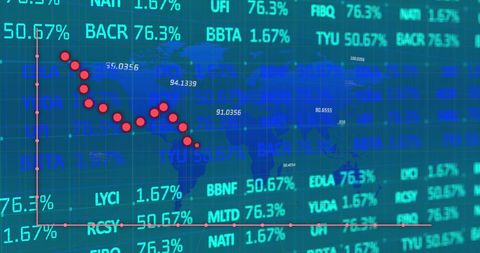
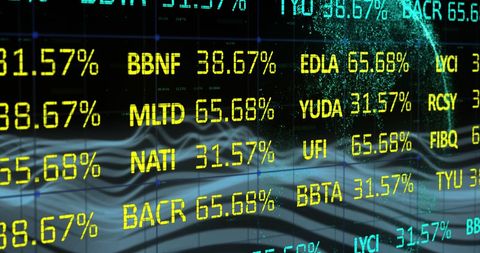
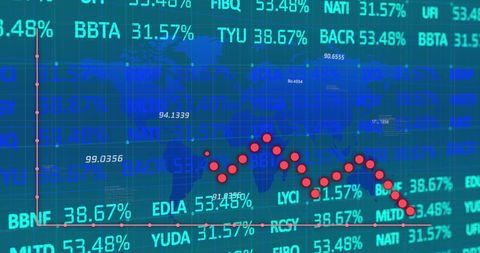
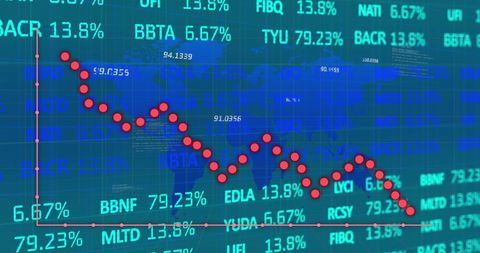
- Financial Data Analysis Amidst Global Fluctuations
Financial Data Analysis Amidst Global Fluctuations Image
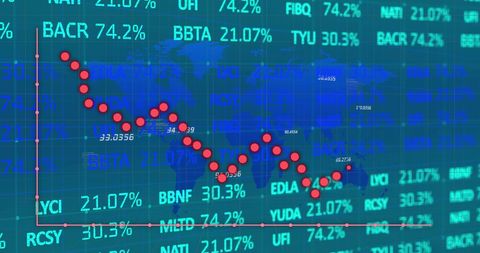
Visual representation of financial data overlaid on digital screen highlighting global market trends. Useful for illustrating global financial analysis, market fluctuations, and technological impacts on economy-related articles, presentations, and reports.
Powered by  - Get 15% off with code: PIKWIZARD15


downloads
Tags:
More
Credit Photo
If you would like to credit the Photo, here are some ways you can do so
Text Link
photo Link
<span class="text-link">
<span>
<a target="_blank" href=https://pikwizard.com/photo/financial-data-analysis-amidst-global-fluctuations/81755860ebf8e4e98215a43e5f3ab88c/>PikWizard</a>
</span>
</span>
<span class="image-link">
<span
style="margin: 0 0 20px 0; display: inline-block; vertical-align: middle; width: 100%;"
>
<a
target="_blank"
href="https://pikwizard.com/photo/financial-data-analysis-amidst-global-fluctuations/81755860ebf8e4e98215a43e5f3ab88c/"
style="text-decoration: none; font-size: 10px; margin: 0;"
>
<img src="https://pikwizard.com/pw/medium/81755860ebf8e4e98215a43e5f3ab88c.jpg" style="margin: 0; width: 100%;" alt="" />
<p style="font-size: 12px; margin: 0;">PikWizard</p>
</a>
</span>
</span>
Free (free of charge)
Free for personal and commercial use.
Author: Authentic Images
Similar Free Stock Images

Premium


Premium

Premium


Premium


Premium


Premium


Premium


Premium


Premium


Premium


Premium


Premium

Premium


Premium


Premium

Premium


Premium

Premium


Premium


Premium


Premium


Premium


Premium


Premium

Premium


Explore More Free Stock Images