
- Home >
- Stock Photos >
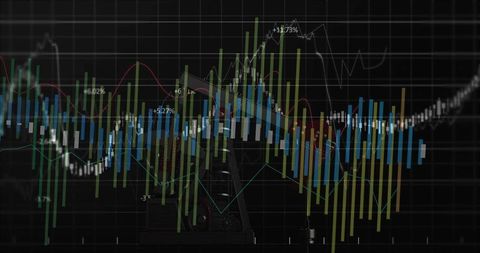
- Financial Data Analysis and Decline Interpretation
Financial Data Analysis and Decline Interpretation Image

Presents data visualization with a downward trend, representing economic decline or negative fiscal data. Useful for financial reports, business presentations, or articles focused on economic analysis and digital finances.
Powered by 


downloads
Tags:
More
Credit Photo
If you would like to credit the Photo, here are some ways you can do so
Text Link
photo Link
<span class="text-link">
<span>
<a target="_blank" href=https://pikwizard.com/photo/financial-data-analysis-and-decline-interpretation/62e4152b5eca49b317b10c8caeeb3981/>PikWizard</a>
</span>
</span>
<span class="image-link">
<span
style="margin: 0 0 20px 0; display: inline-block; vertical-align: middle; width: 100%;"
>
<a
target="_blank"
href="https://pikwizard.com/photo/financial-data-analysis-and-decline-interpretation/62e4152b5eca49b317b10c8caeeb3981/"
style="text-decoration: none; font-size: 10px; margin: 0;"
>
<img src="https://pikwizard.com/pw/medium/62e4152b5eca49b317b10c8caeeb3981.jpg" style="margin: 0; width: 100%;" alt="" />
<p style="font-size: 12px; margin: 0;">PikWizard</p>
</a>
</span>
</span>
Free (free of charge)
Free for personal and commercial use.
Author: Creative Art
Similar Free Stock Images

Premium


Premium


AI


Premium


Premium


Premium


Premium


Premium


Premium

Premium


Premium


Premium

Premium

Premium


Premium


Premium


Premium


Premium


Premium


Premium


Premium


Premium


Premium


Premium


Premium


Premium


Explore More Free Stock Images