
- Home >
- Stock Photos >
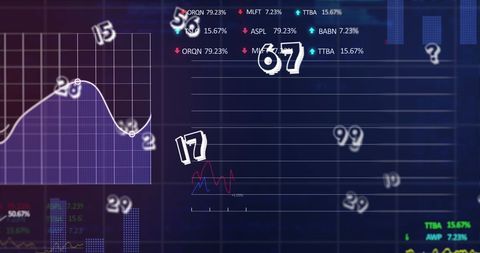
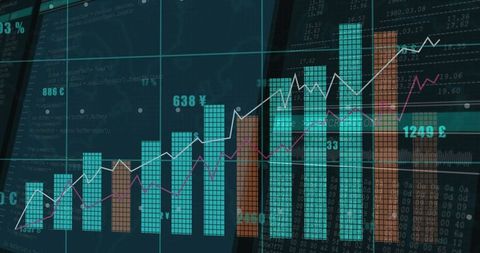
- Financial Data Analysis and Digital Financial Interface
Financial Data Analysis and Digital Financial Interface Image

Virtual finance platforms, investment analysis discussions, blogs about data trends, educational material on financial technology and network systems benefitting attitude towards digital transactions and international networking.
Powered by 


downloads
Tags:
More
Credit Photo
If you would like to credit the Photo, here are some ways you can do so
Text Link
photo Link
<span class="text-link">
<span>
<a target="_blank" href=https://pikwizard.com/photo/financial-data-analysis-and-digital-financial-interface/2a8544fbf1dff8b69ebf8f9b77cbc1c8/>PikWizard</a>
</span>
</span>
<span class="image-link">
<span
style="margin: 0 0 20px 0; display: inline-block; vertical-align: middle; width: 100%;"
>
<a
target="_blank"
href="https://pikwizard.com/photo/financial-data-analysis-and-digital-financial-interface/2a8544fbf1dff8b69ebf8f9b77cbc1c8/"
style="text-decoration: none; font-size: 10px; margin: 0;"
>
<img src="https://pikwizard.com/pw/medium/2a8544fbf1dff8b69ebf8f9b77cbc1c8.jpg" style="margin: 0; width: 100%;" alt="" />
<p style="font-size: 12px; margin: 0;">PikWizard</p>
</a>
</span>
</span>
Free (free of charge)
Free for personal and commercial use.
Author: People Creations
Similar Free Stock Images

Premium


Premium


Premium


Premium


Premium


Premium

Premium


Premium


Premium

Premium


Premium


Premium

Premium


Premium


Premium


Premium


Premium


Premium

Premium


Premium

Premium


Premium

Premium


Premium

Premium


Explore More Free Stock Images