- Home >
- Stock Photos >
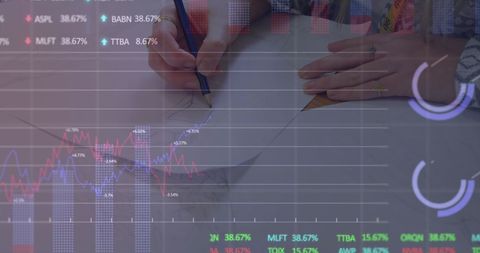
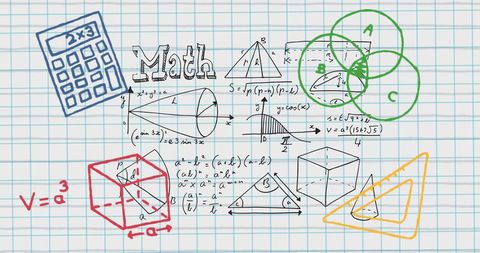
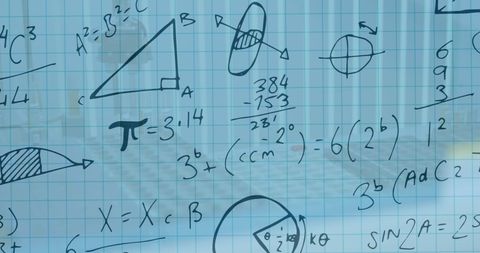
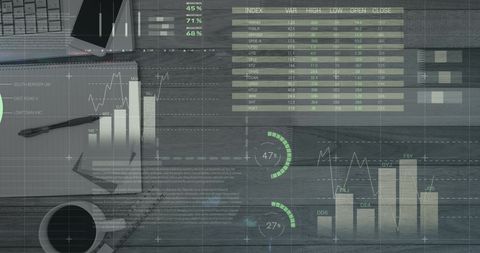
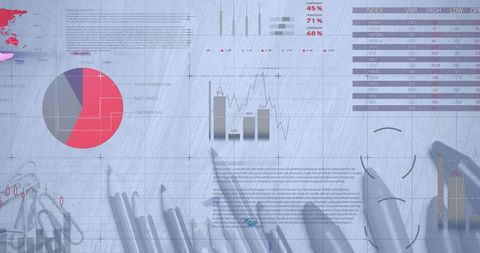
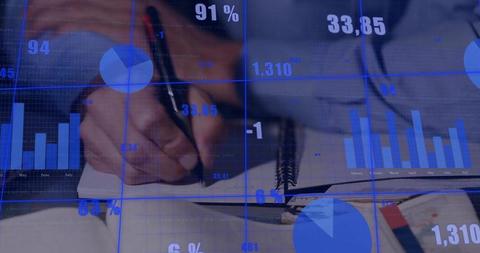
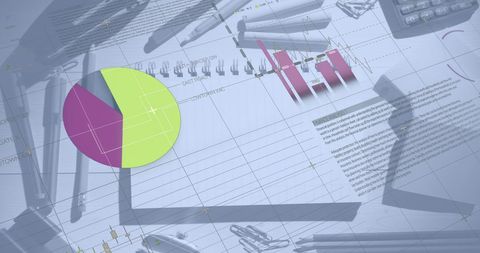
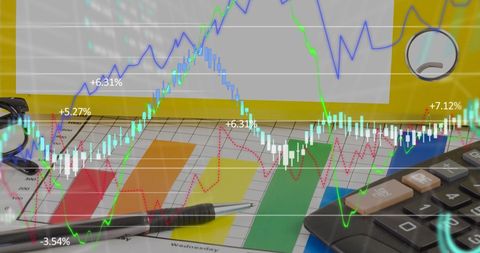
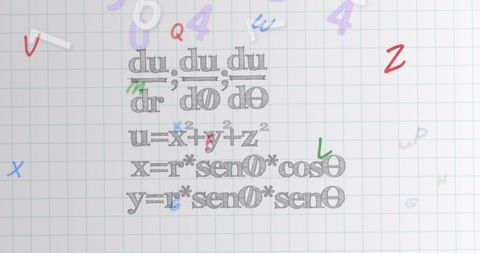
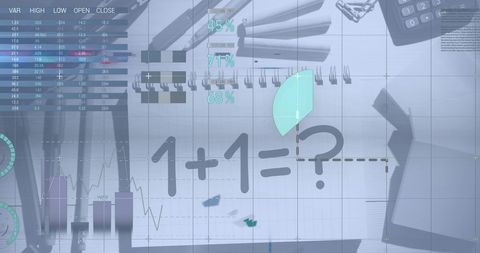
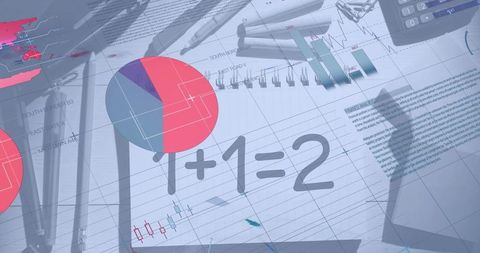
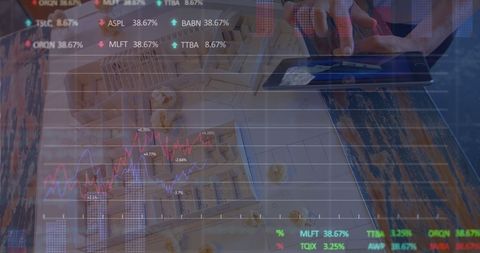
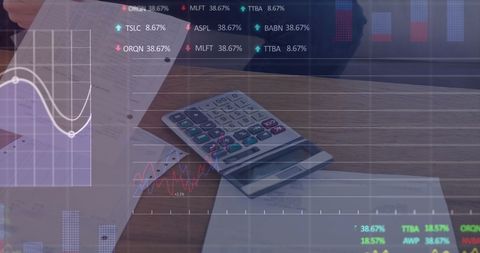
- Financial Data Analysis and Mathematical Calculations Integration
Financial Data Analysis and Mathematical Calculations Integration Image
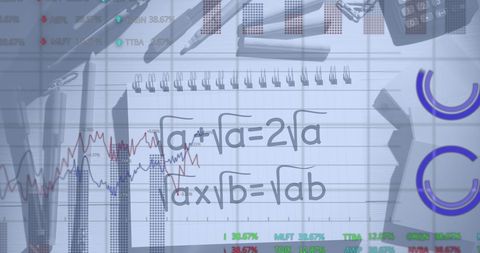
Depicts integration of financial data analysis with mathematical principles. Helpful for illustrating complex correlations in business and finance topics, technology-driven growth strategies, and educational materials in mathematics and business analytics.

downloads
Tags:
More
Credit Photo
If you would like to credit the Photo, here are some ways you can do so
Text Link
photo Link
<span class="text-link">
<span>
<a target="_blank" href=https://pikwizard.com/photo/financial-data-analysis-and-mathematical-calculations-integration/f695d7b237cfc94c2e2d23b3235de438/>PikWizard</a>
</span>
</span>
<span class="image-link">
<span
style="margin: 0 0 20px 0; display: inline-block; vertical-align: middle; width: 100%;"
>
<a
target="_blank"
href="https://pikwizard.com/photo/financial-data-analysis-and-mathematical-calculations-integration/f695d7b237cfc94c2e2d23b3235de438/"
style="text-decoration: none; font-size: 10px; margin: 0;"
>
<img src="https://pikwizard.com/pw/medium/f695d7b237cfc94c2e2d23b3235de438.jpg" style="margin: 0; width: 100%;" alt="" />
<p style="font-size: 12px; margin: 0;">PikWizard</p>
</a>
</span>
</span>
Free (free of charge)
Free for personal and commercial use.
Author: People Creations