- Home >
- Stock Photos >
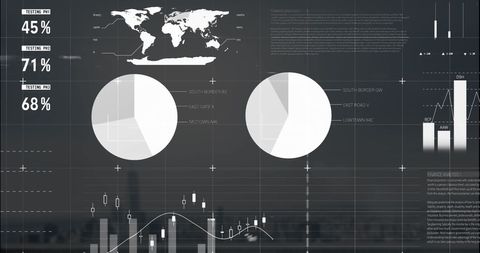
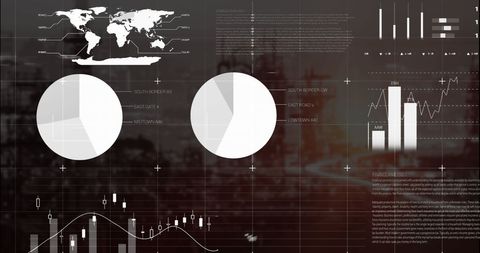
- Financial Data Analysis and Statistics in Global Network Interface
Financial Data Analysis and Statistics in Global Network Interface Image

Visual abstract illustrating global financial data analysis with digital overlay. Perfect for technology-related content, financial analysis, data science projects, and educational materials showcasing digital interfaces and analytic trends. Suitable for use in presentations, advertisements, or articles on finance, technology advancements, and global economic data monitoring.

downloads
Tags:
More
Credit Photo
If you would like to credit the Photo, here are some ways you can do so
Text Link
photo Link
<span class="text-link">
<span>
<a target="_blank" href=https://pikwizard.com/photo/financial-data-analysis-and-statistics-in-global-network-interface/b82e8c292d9c8962b810c7aff7eafbfc/>PikWizard</a>
</span>
</span>
<span class="image-link">
<span
style="margin: 0 0 20px 0; display: inline-block; vertical-align: middle; width: 100%;"
>
<a
target="_blank"
href="https://pikwizard.com/photo/financial-data-analysis-and-statistics-in-global-network-interface/b82e8c292d9c8962b810c7aff7eafbfc/"
style="text-decoration: none; font-size: 10px; margin: 0;"
>
<img src="https://pikwizard.com/pw/medium/b82e8c292d9c8962b810c7aff7eafbfc.jpg" style="margin: 0; width: 100%;" alt="" />
<p style="font-size: 12px; margin: 0;">PikWizard</p>
</a>
</span>
</span>
Free (free of charge)
Free for personal and commercial use.
Author: Authentic Images