
- Home >
- Stock Photos >
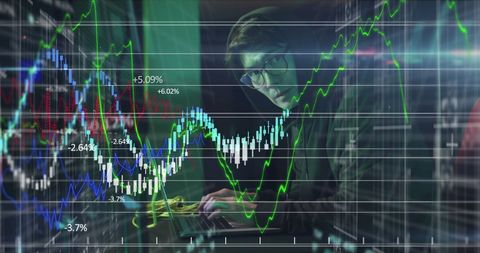
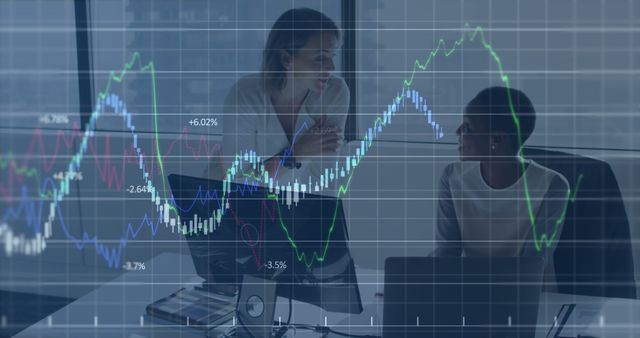
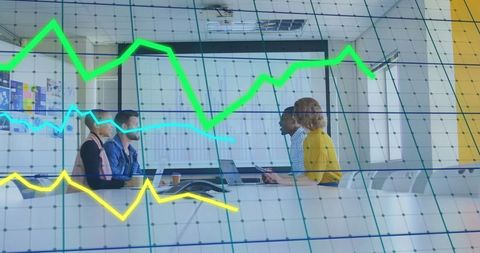
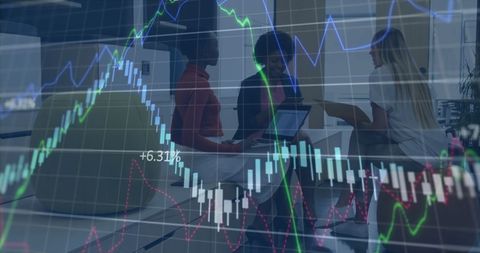
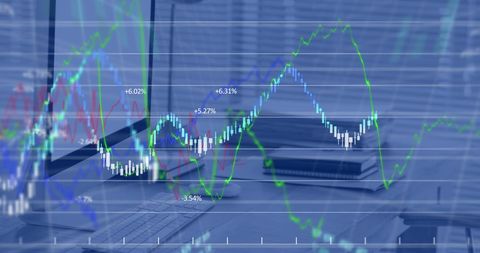
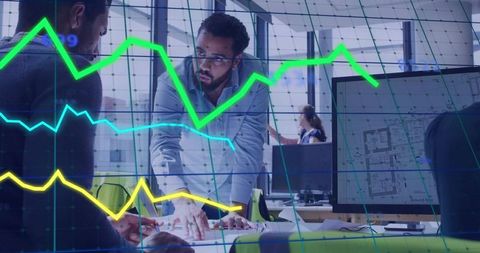
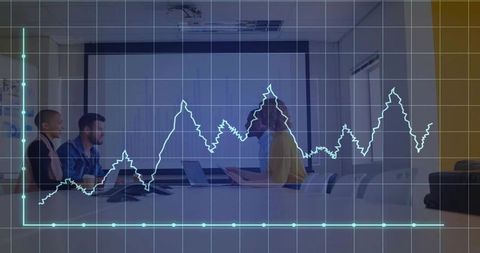
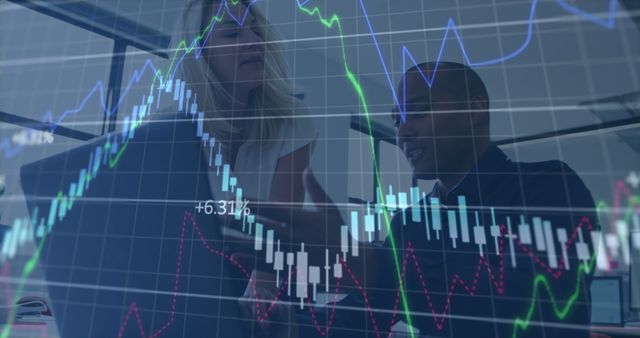
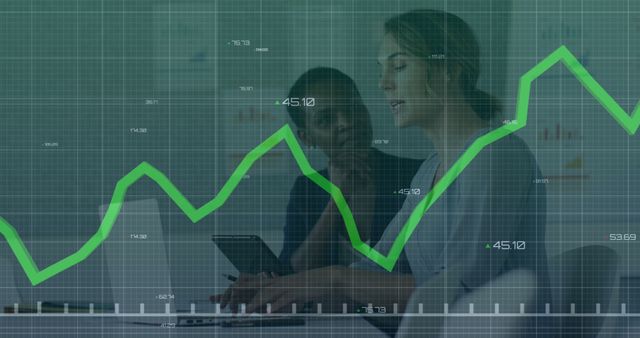
- Financial Data Analysis and Technological Interface at Office
Financial Data Analysis and Technological Interface at Office Image

Abstract view of financial graphs and data projections overlaying office desks filled with technology. Useful for illustrating finance stories or business articles focusing on financial analysis, stock market activities, and economic trends in a modern office environment.
Powered by  - Get 15% off with code: PIKWIZARD15


downloads
Tags:
More
Credit Photo
If you would like to credit the Photo, here are some ways you can do so
Text Link
photo Link
<span class="text-link">
<span>
<a target="_blank" href=https://pikwizard.com/photo/financial-data-analysis-and-technological-interface-at-office/8200757767f4835e0c6954660b978e2a/>PikWizard</a>
</span>
</span>
<span class="image-link">
<span
style="margin: 0 0 20px 0; display: inline-block; vertical-align: middle; width: 100%;"
>
<a
target="_blank"
href="https://pikwizard.com/photo/financial-data-analysis-and-technological-interface-at-office/8200757767f4835e0c6954660b978e2a/"
style="text-decoration: none; font-size: 10px; margin: 0;"
>
<img src="https://pikwizard.com/pw/medium/8200757767f4835e0c6954660b978e2a.jpg" style="margin: 0; width: 100%;" alt="" />
<p style="font-size: 12px; margin: 0;">PikWizard</p>
</a>
</span>
</span>
Free (free of charge)
Free for personal and commercial use.
Author: Creative Art
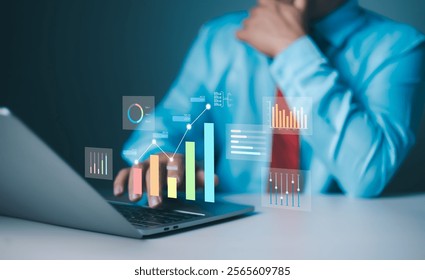
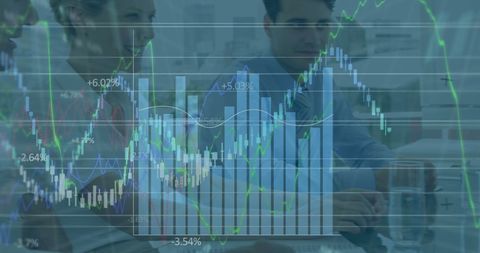
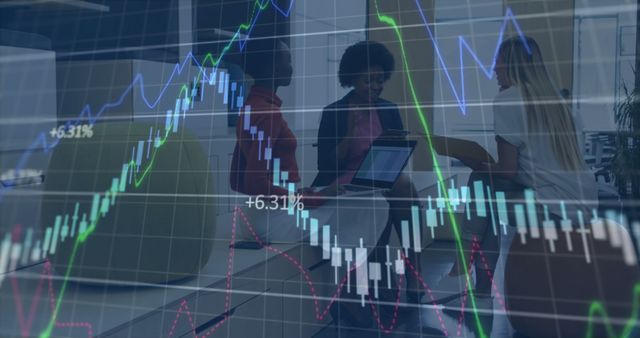
Similar Free Stock Images

Premium


Premium

Premium


Premium

Premium


Premium


Premium


Premium

Premium


Premium

Premium

Premium

Premium


Premium


Premium

Premium

Premium


Premium

Premium


Premium


Premium


Premium

Premium


Premium

Premium


Explore More Free Stock Images