- Home >
- Stock Photos >
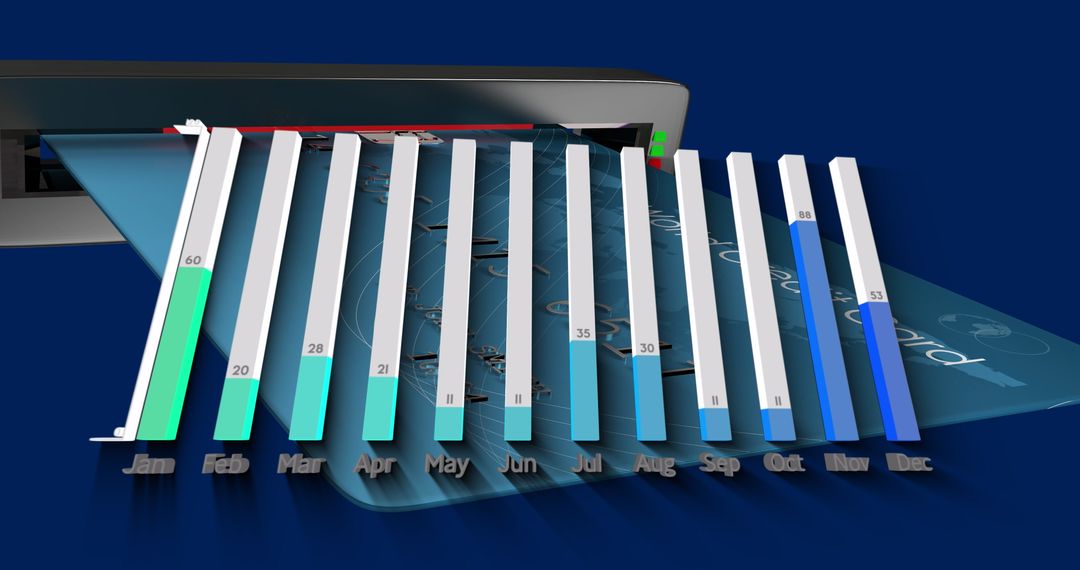
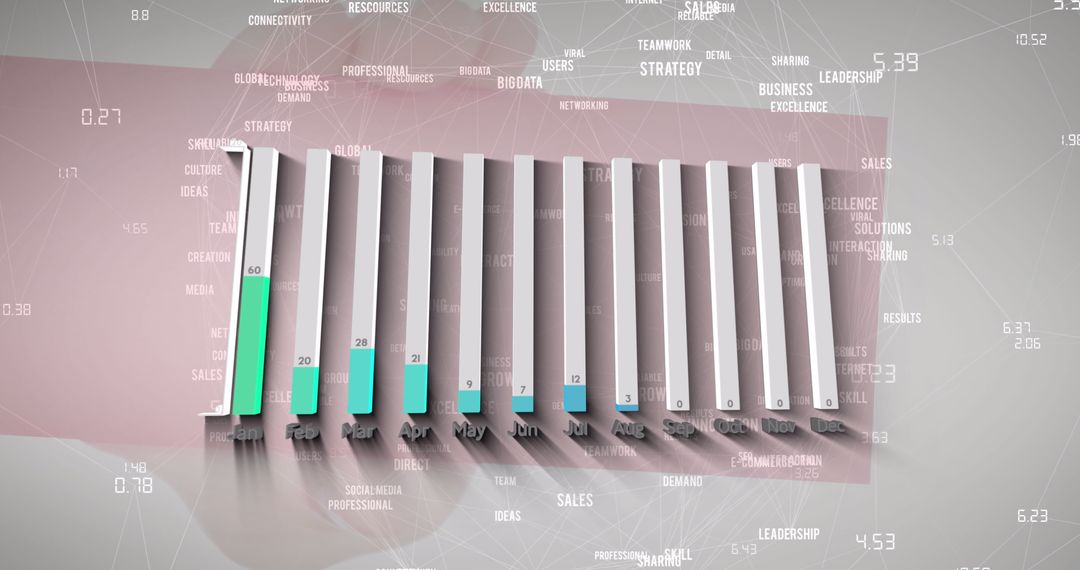
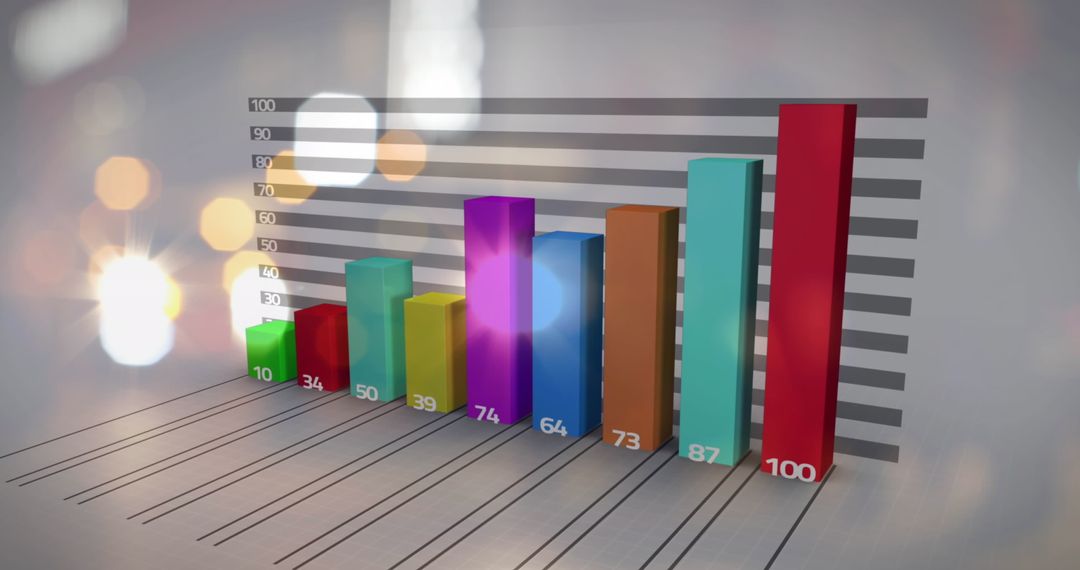
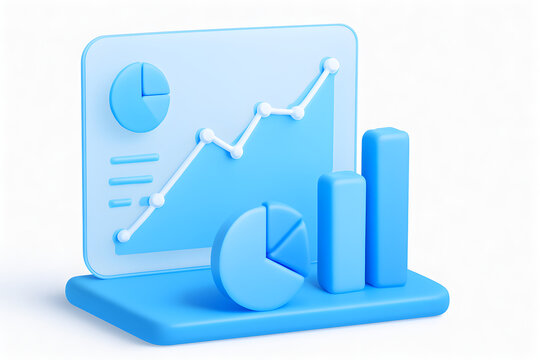
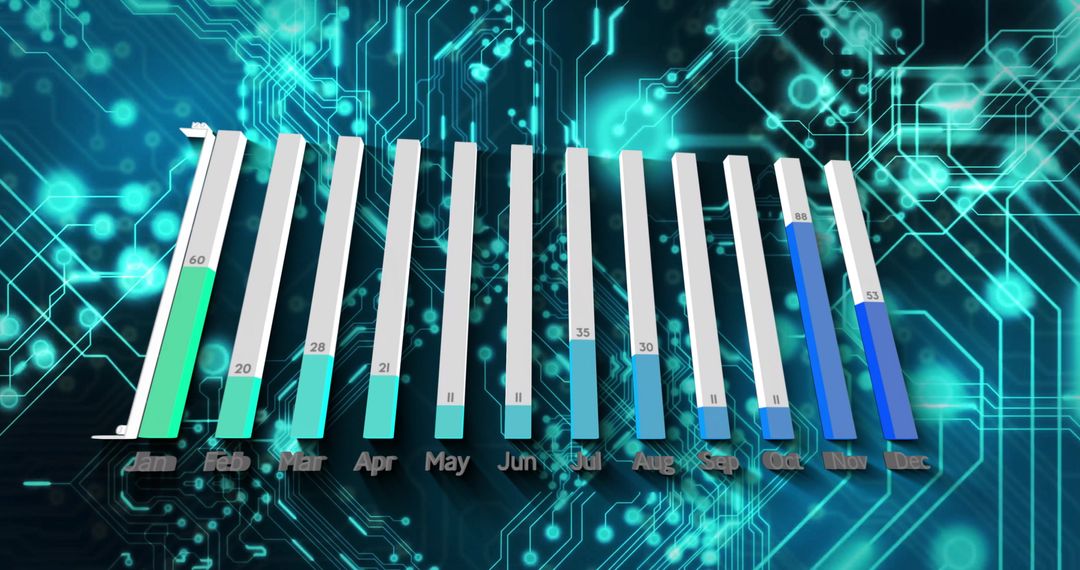
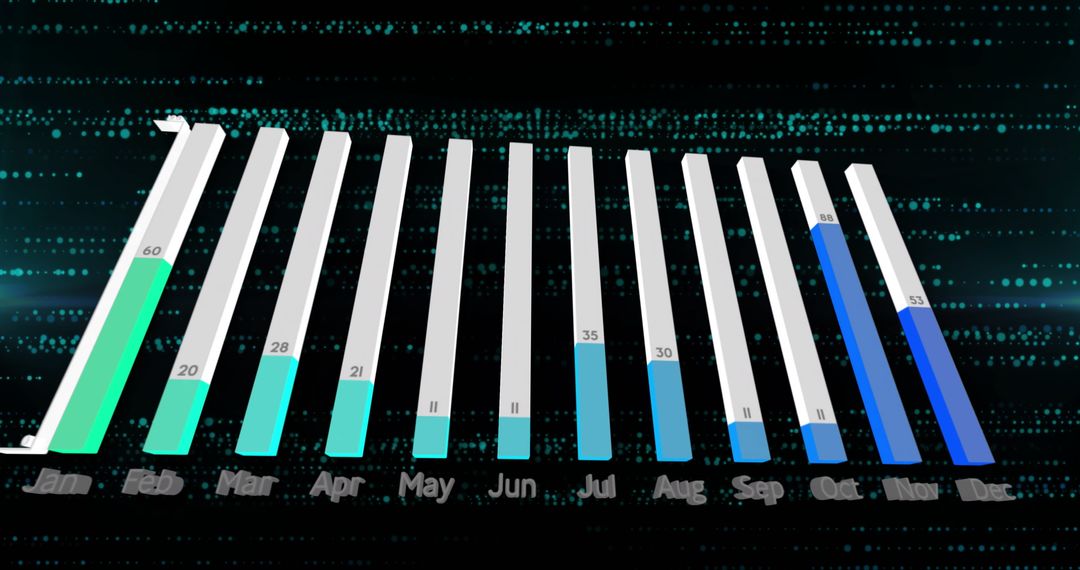
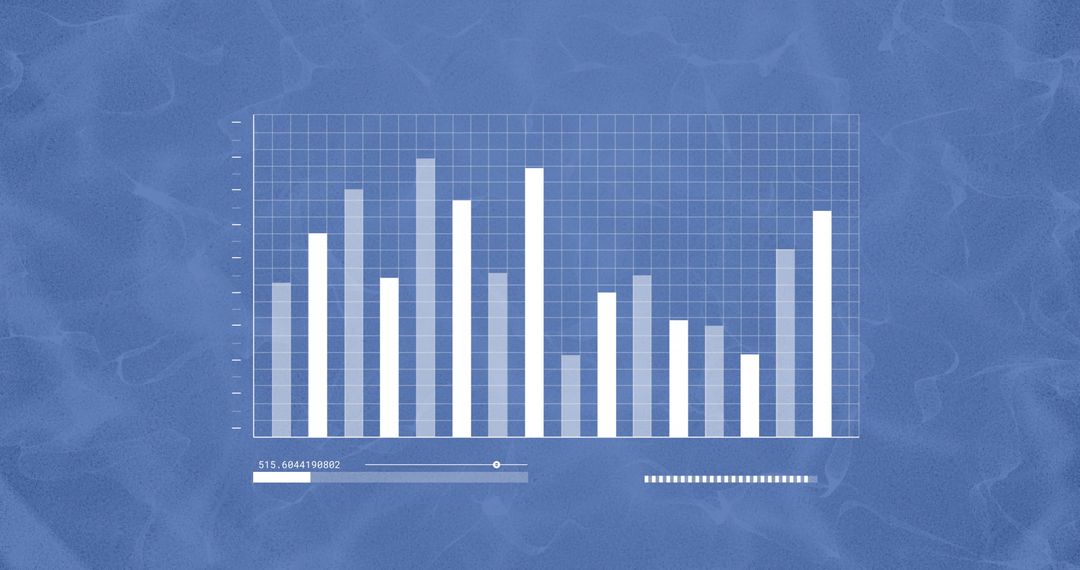
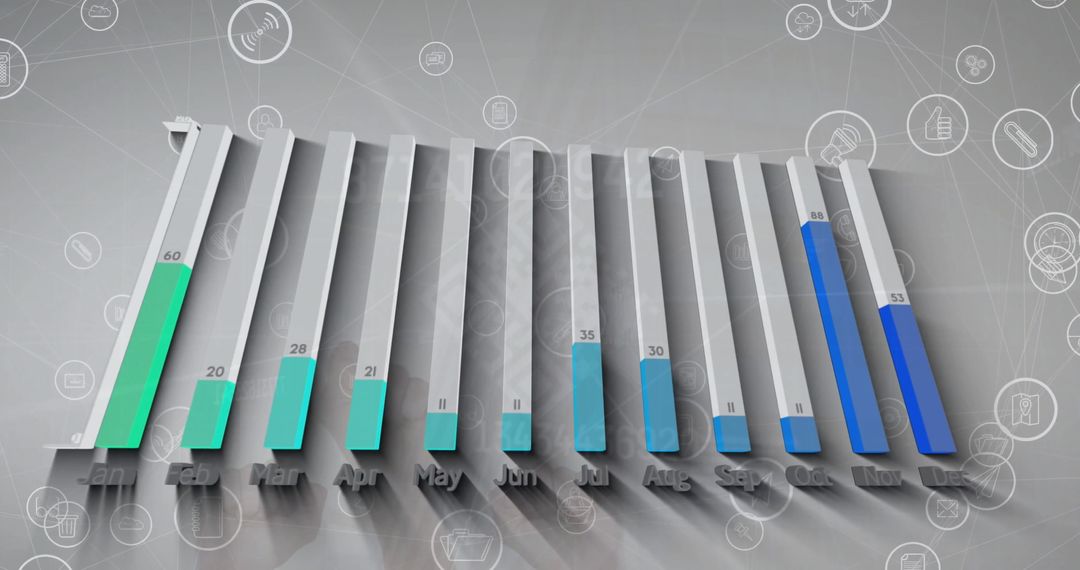
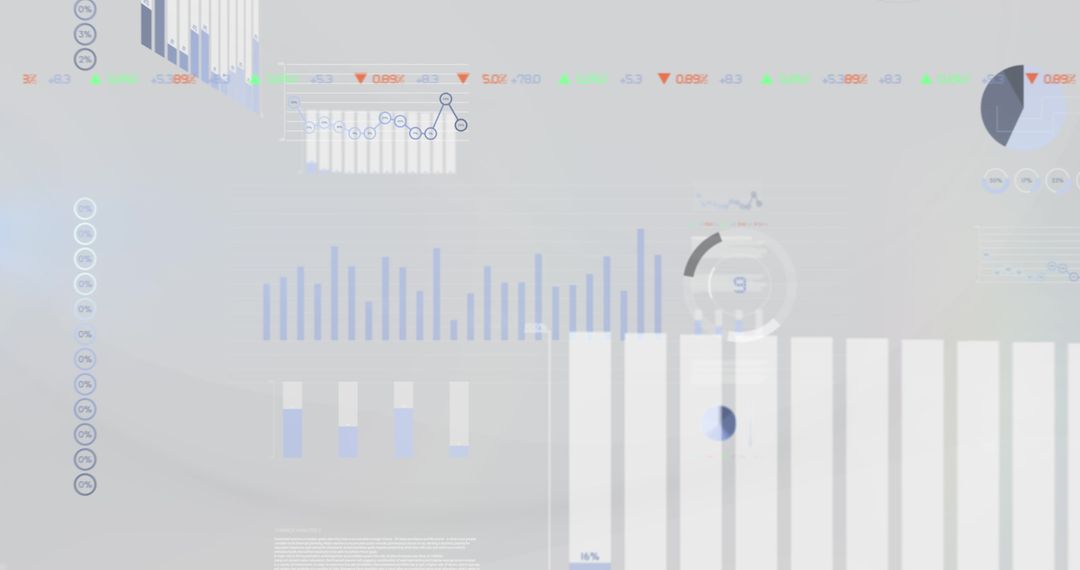
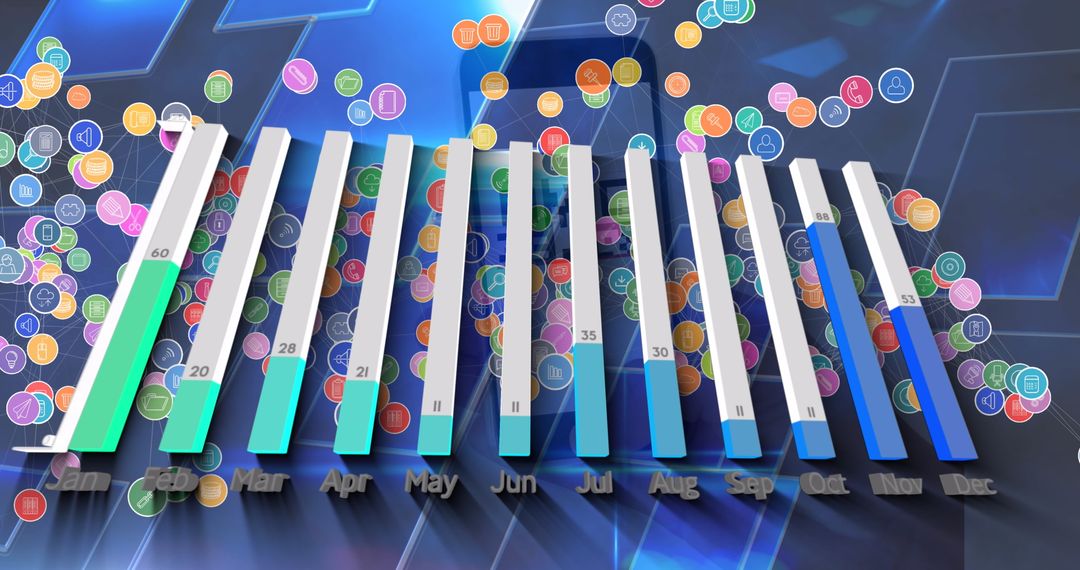
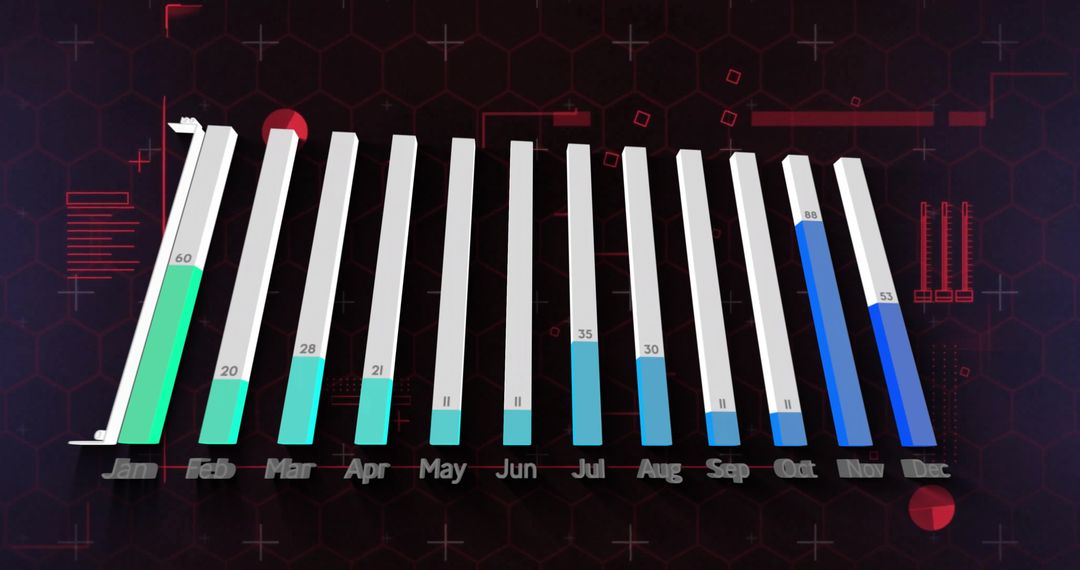
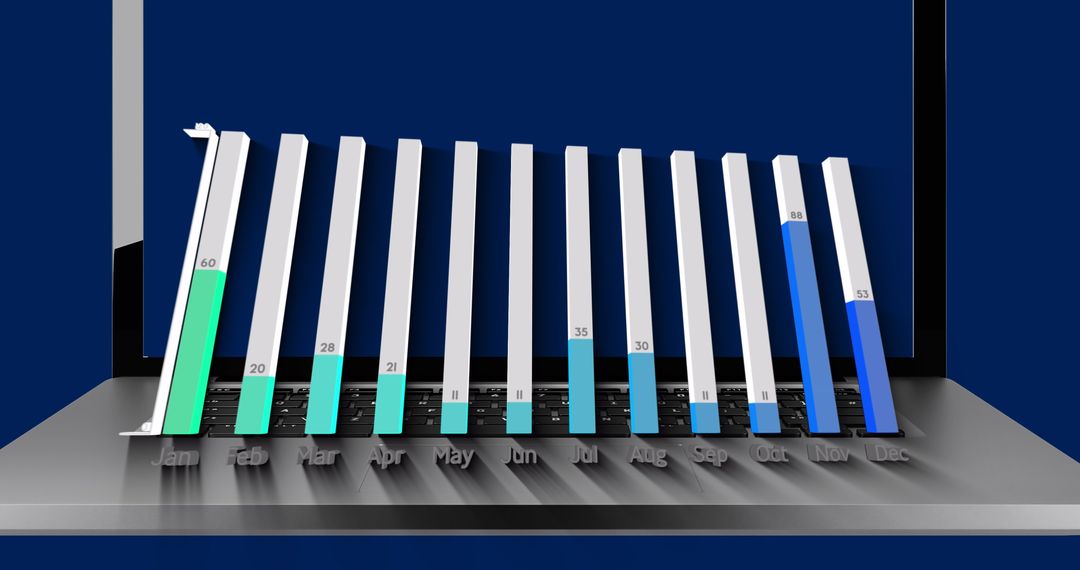
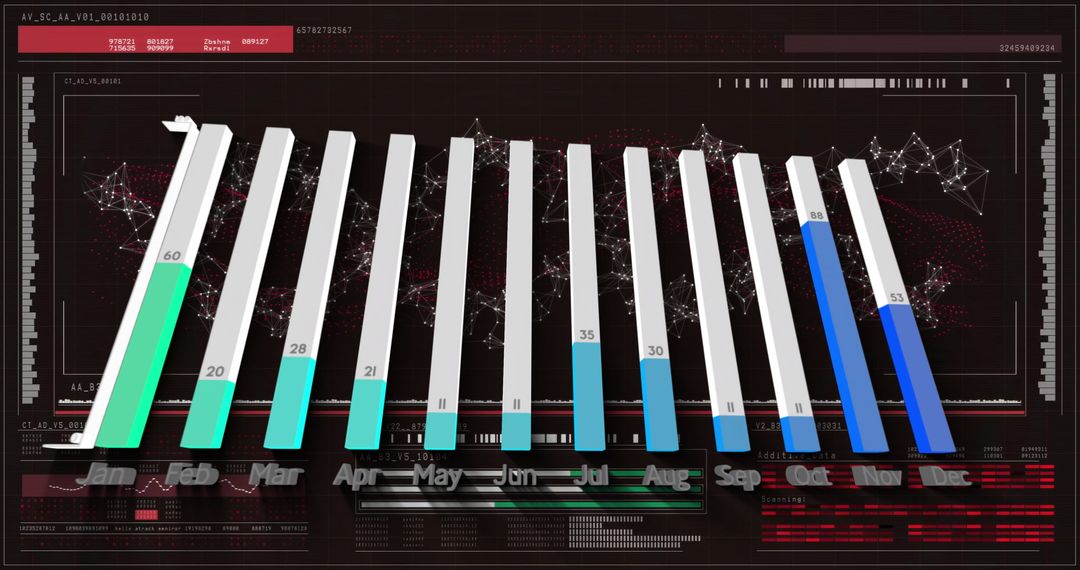
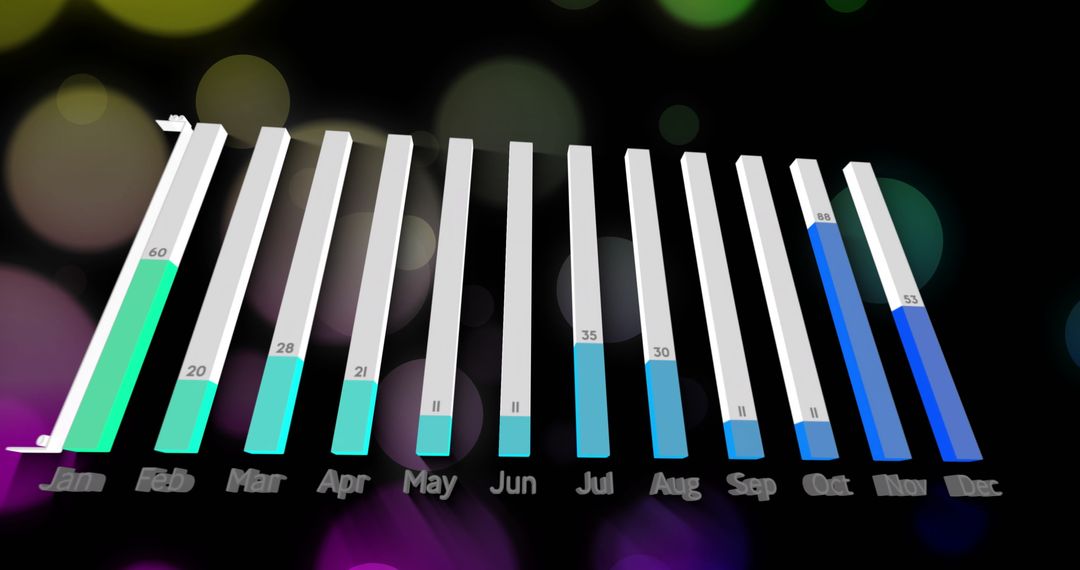
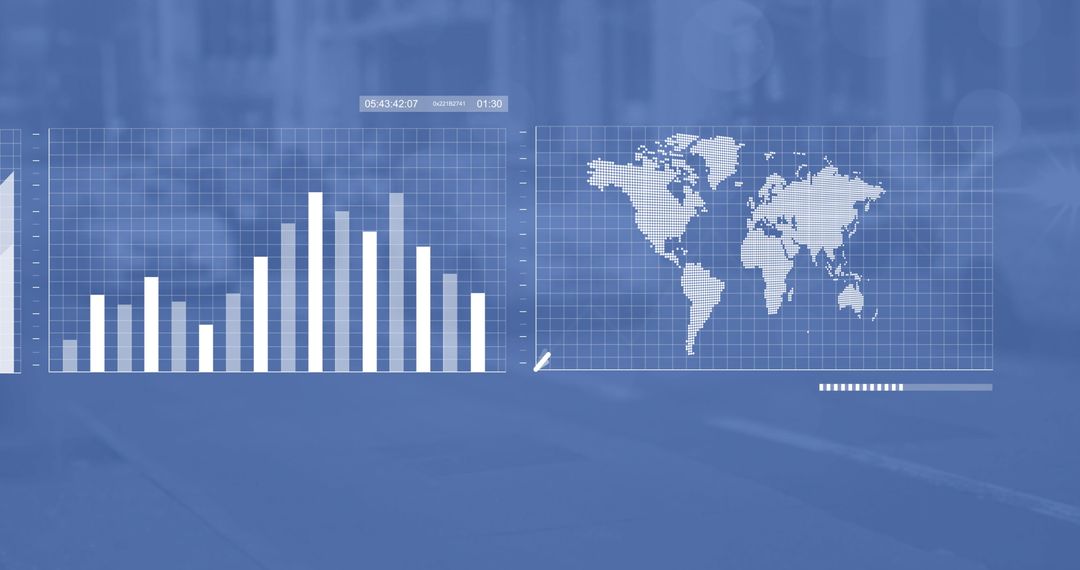
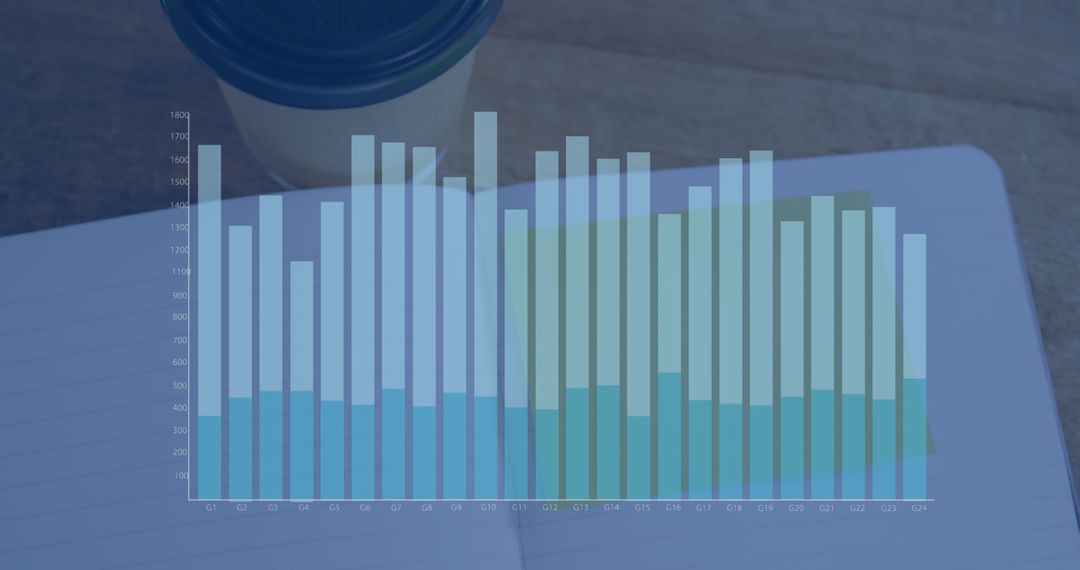
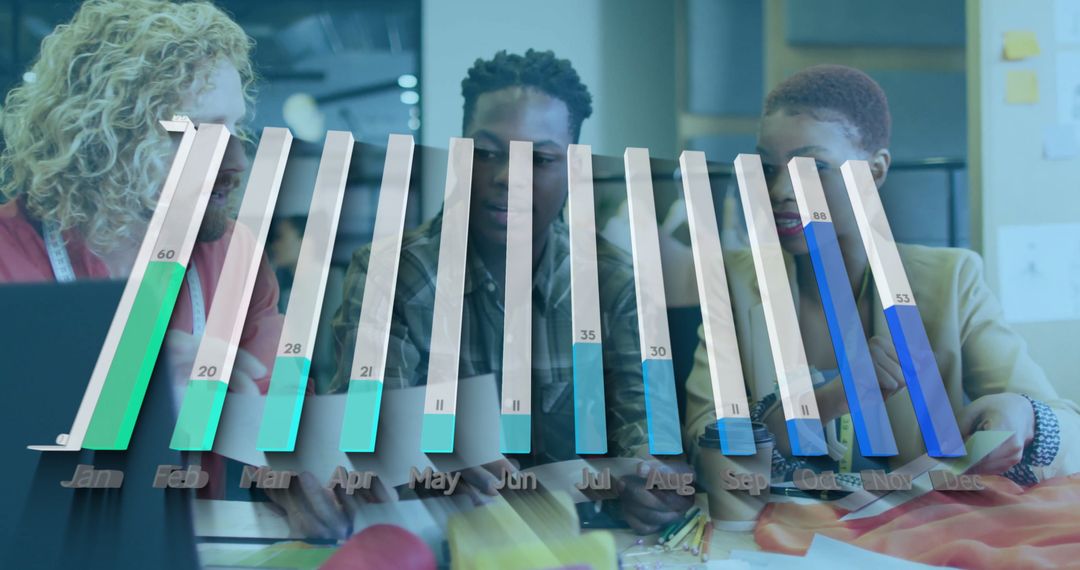
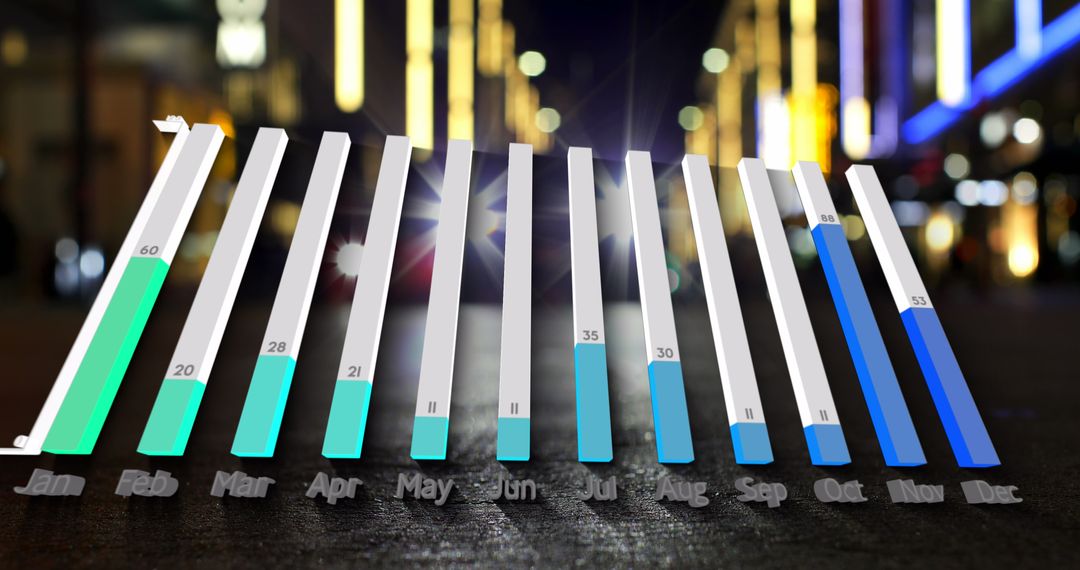
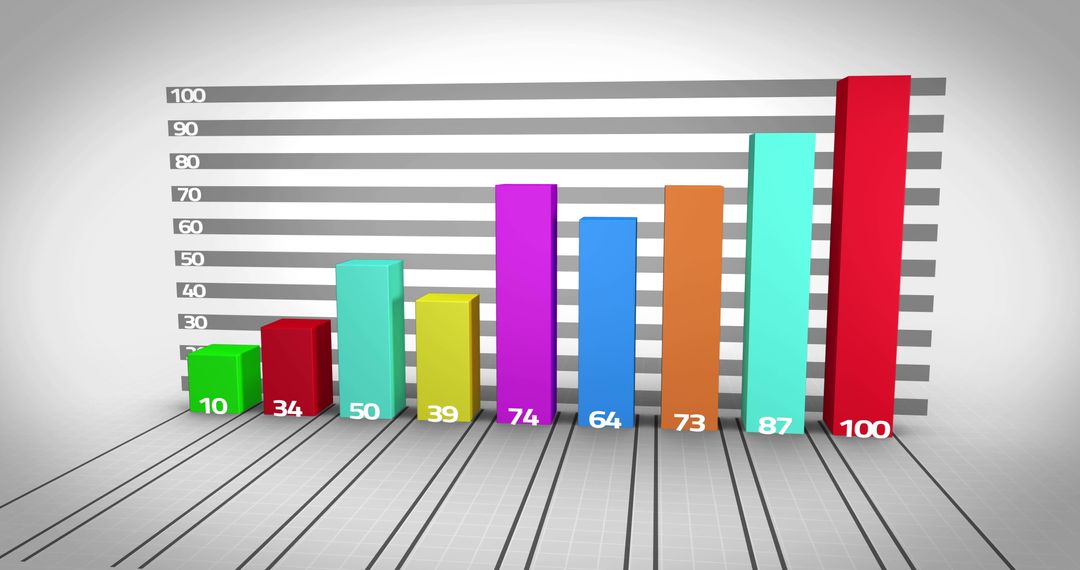
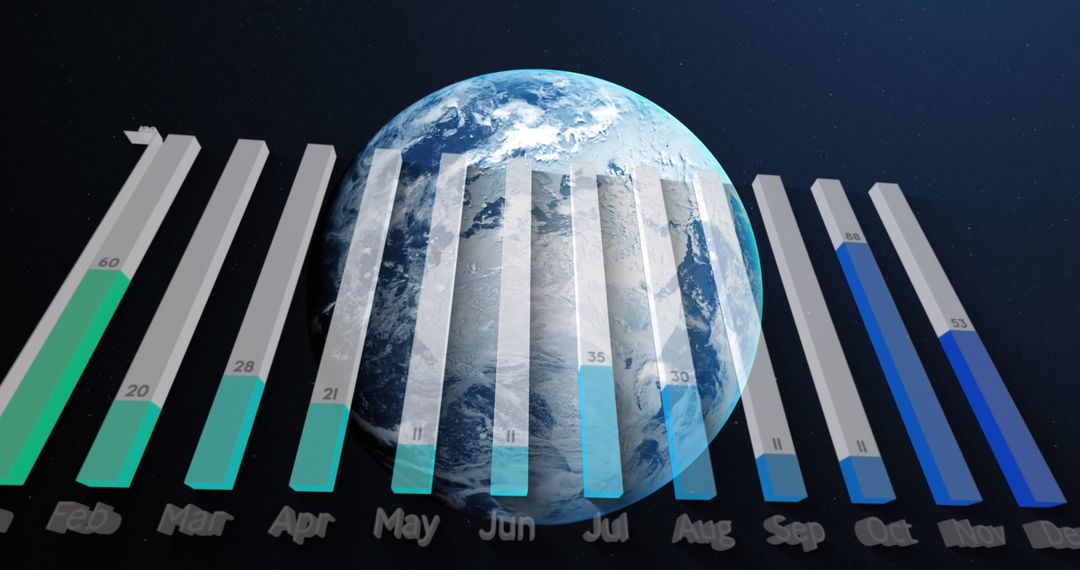
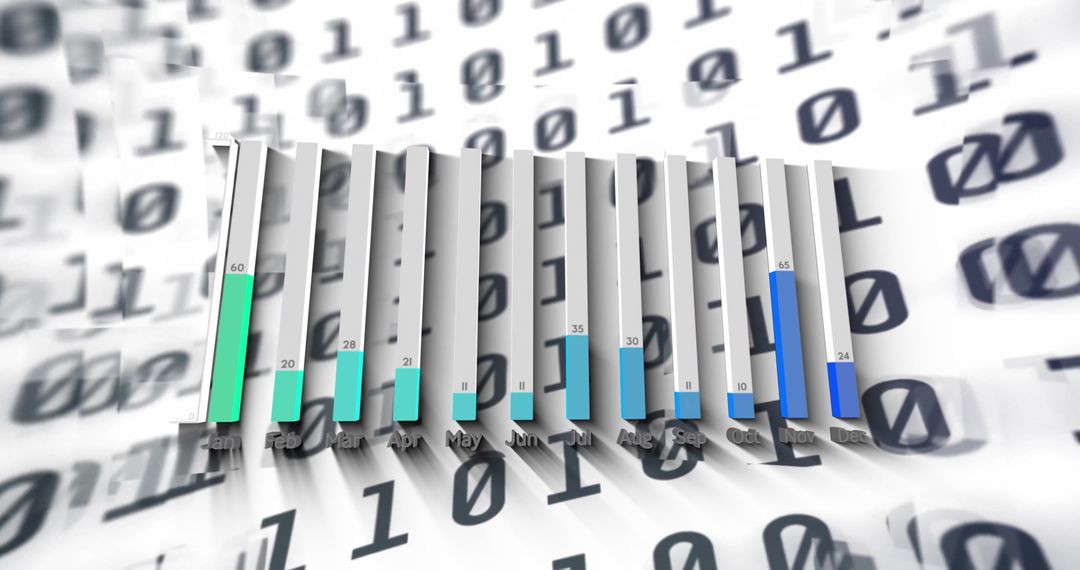
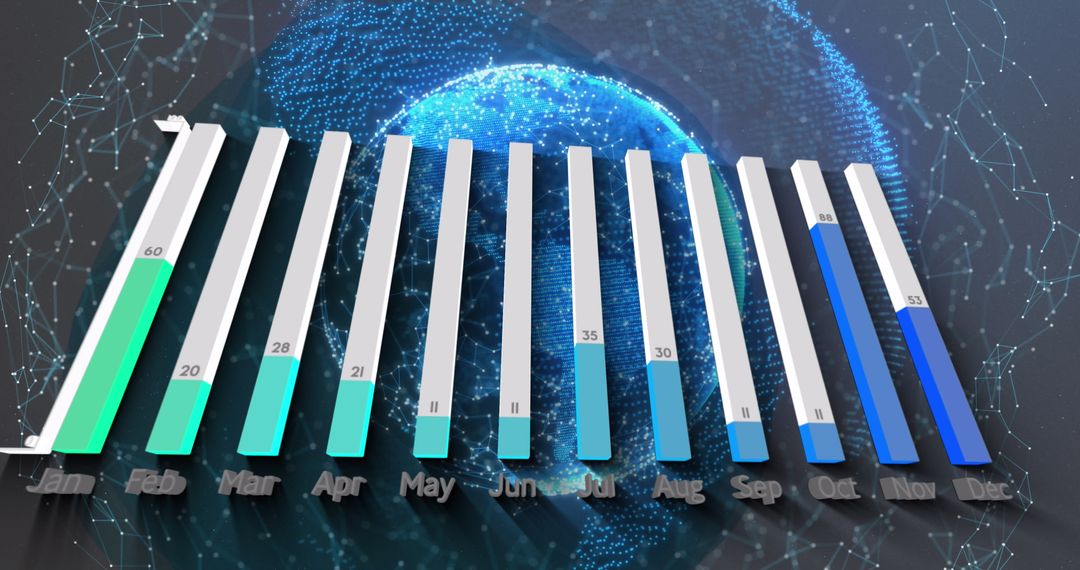
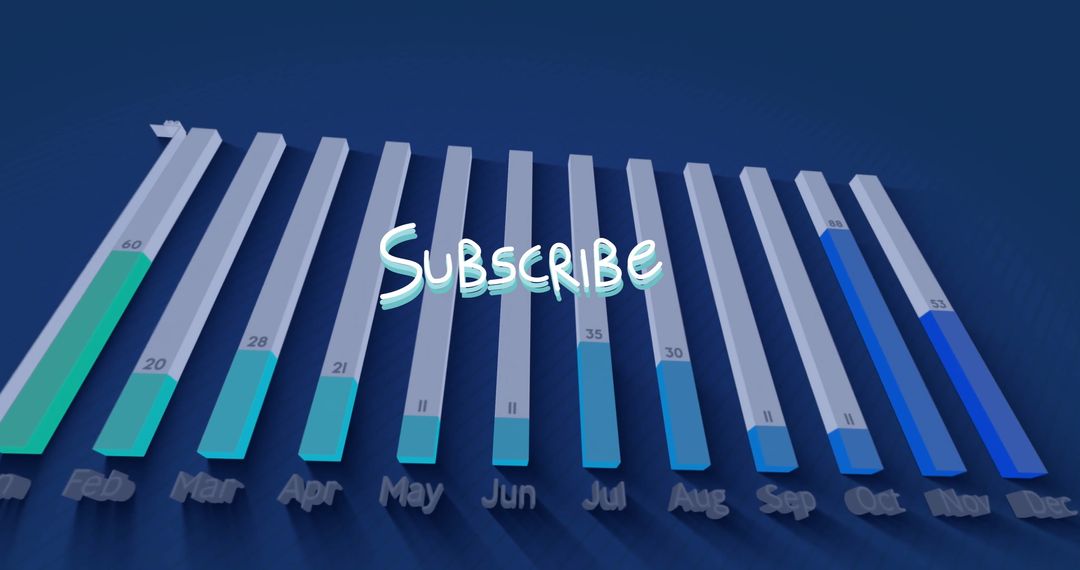
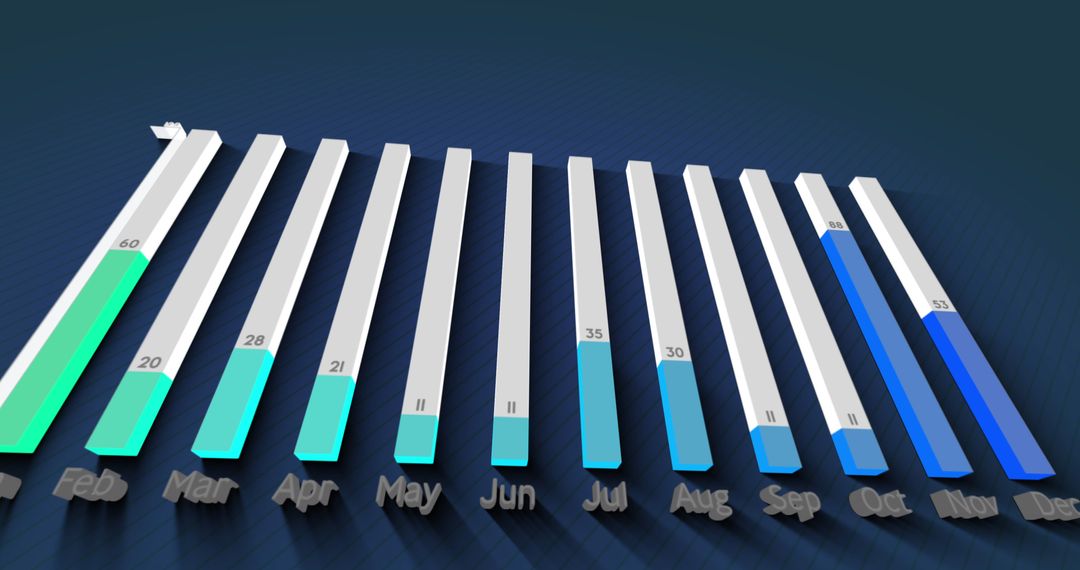
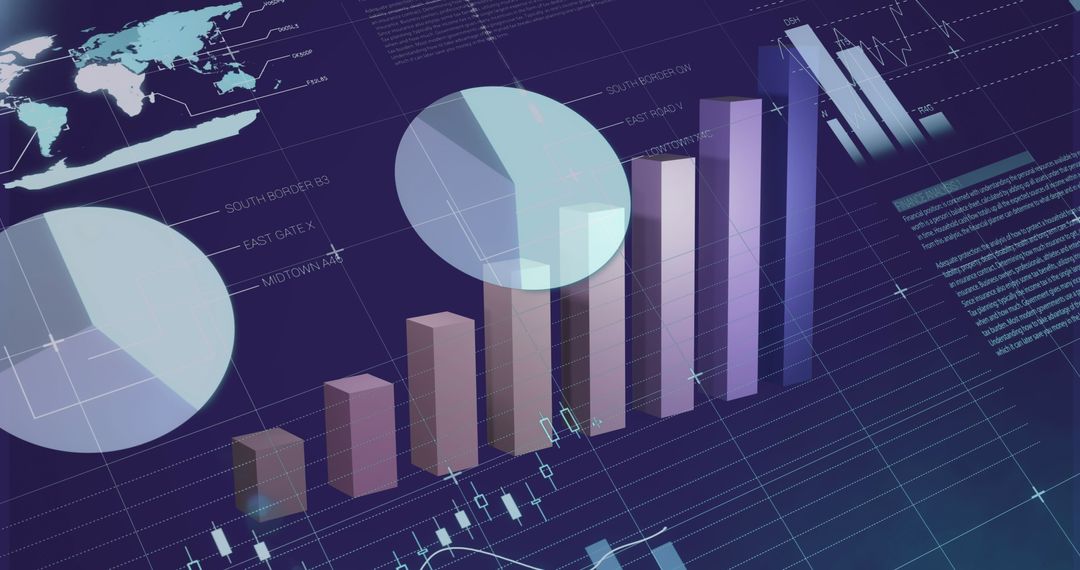
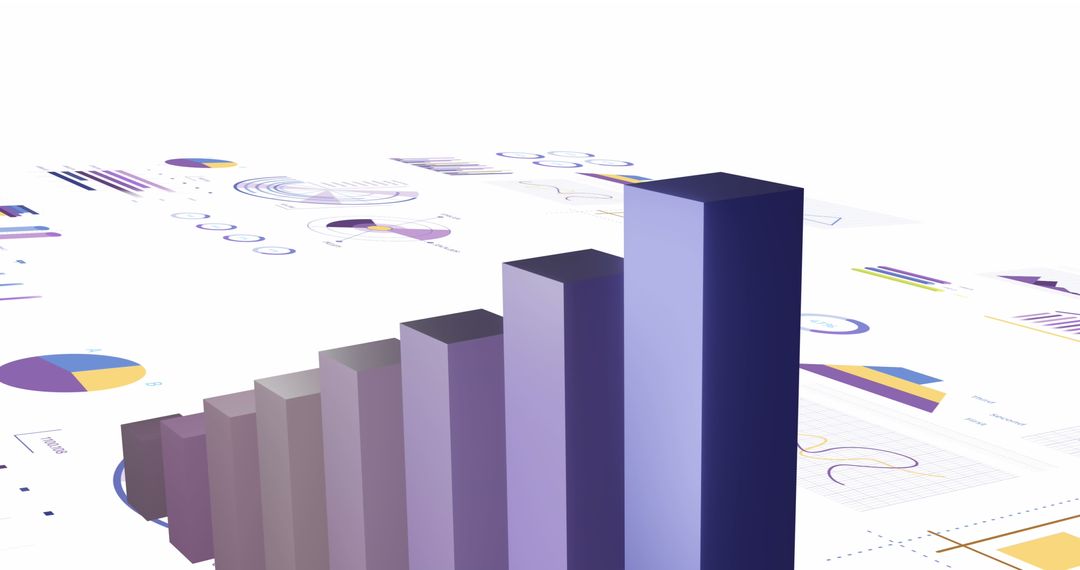
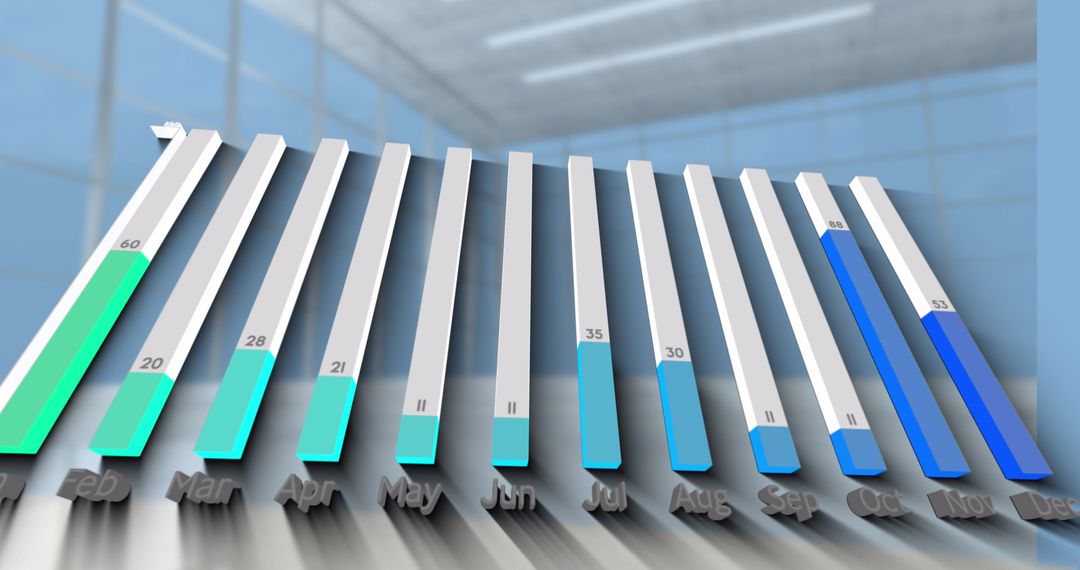
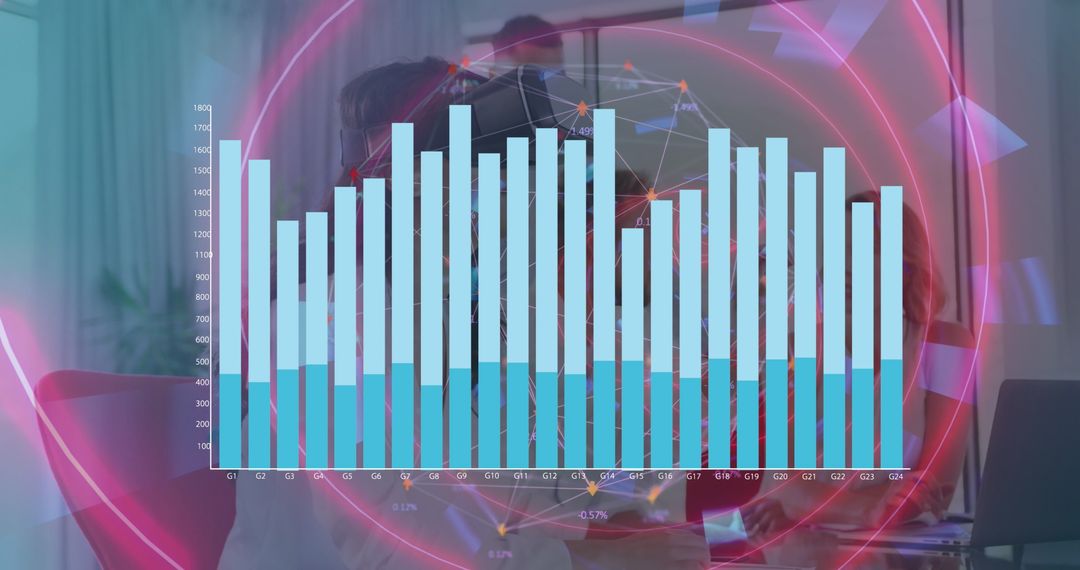
- Financial Data Analysis Concept with Digital Icons and Bar Graphs
Financial Data Analysis Concept with Digital Icons and Bar Graphs Image

Visual representation of financial data processing showcasing bar graphs for monthly analysis. Digital icons enhancing business and technology themes provide elements indicating communication, computing, and finance. A potential resource for illustrating articles on finance, financial technology, or business analytics, emphasizing the integration of technology in financial monitoring.
Powered by 


8
downloads
downloads
Tags:
More
Credit Photo
If you would like to credit the Photo, here are some ways you can do so
Text Link
photo Link
<span class="text-link">
<span>
<a target="_blank" href=https://pikwizard.com/photo/financial-data-analysis-concept-with-digital-icons-and-bar-graphs/39fab9385a65906ef3e30b241c6a4772/>PikWizard</a>
</span>
</span>
<span class="image-link">
<span
style="margin: 0 0 20px 0; display: inline-block; vertical-align: middle; width: 100%;"
>
<a
target="_blank"
href="https://pikwizard.com/photo/financial-data-analysis-concept-with-digital-icons-and-bar-graphs/39fab9385a65906ef3e30b241c6a4772/"
style="text-decoration: none; font-size: 10px; margin: 0;"
>
<img src="https://pikwizard.com/pw/medium/39fab9385a65906ef3e30b241c6a4772.jpg" style="margin: 0; width: 100%;" alt="" />
<p style="font-size: 12px; margin: 0;">PikWizard</p>
</a>
</span>
</span>
Free (free of charge)
Free for personal and commercial use.
Author: Authentic Images
Similar Free Stock Images

Premium


Premium


Premium

Premium


Premium

Premium


Premium


Premium


Premium


Premium


Premium


Premium


Premium


Premium


Premium


Premium


Premium


Premium


Premium


Premium


Premium


Premium


Premium


Premium