
- Home >
- Stock Photos >
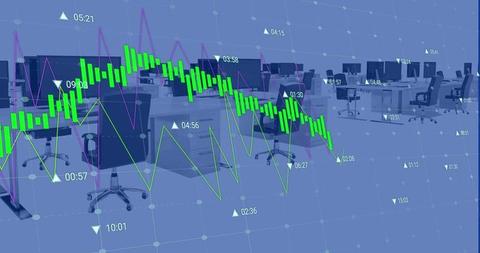
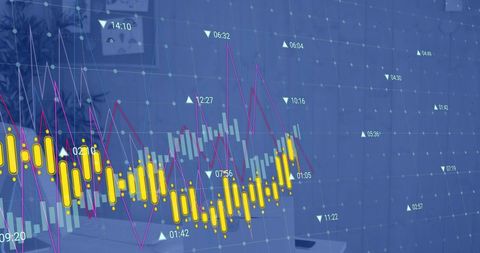
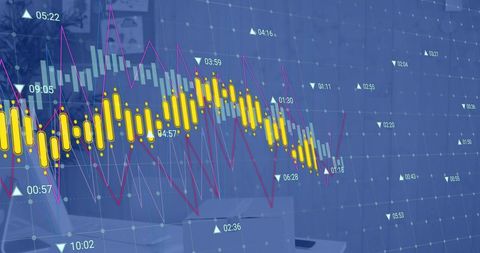
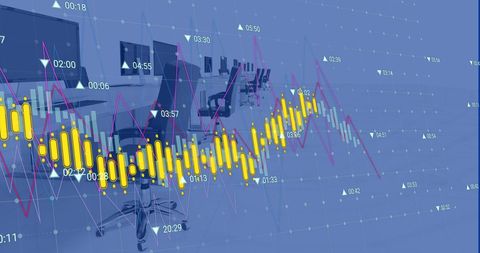
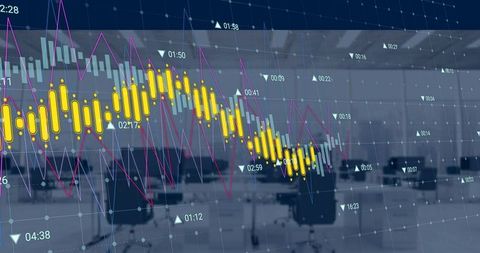
- Financial Data Analysis Concept with Graphs on Office Desktops
Financial Data Analysis Concept with Graphs on Office Desktops Image

Depicting a dynamic atmosphere of financial analysis, multiple screens display intricate data with graphs and charts. This conveys the intersection of modern technology and business practices, ideal for illustrating themes like finance analytics, trading environments, investment opportunities, or tech-driven market understanding. This imagery resonates with financial institutions, consultants, business publications, or educational resources focusing on economics.
Powered by  - Get 15% off with code: PIKWIZARD15


downloads
Tags:
More
Credit Photo
If you would like to credit the Photo, here are some ways you can do so
Text Link
photo Link
<span class="text-link">
<span>
<a target="_blank" href=https://pikwizard.com/photo/financial-data-analysis-concept-with-graphs-on-office-desktops/ffe9dd70a772d0cf052d49d8b2e650c7/>PikWizard</a>
</span>
</span>
<span class="image-link">
<span
style="margin: 0 0 20px 0; display: inline-block; vertical-align: middle; width: 100%;"
>
<a
target="_blank"
href="https://pikwizard.com/photo/financial-data-analysis-concept-with-graphs-on-office-desktops/ffe9dd70a772d0cf052d49d8b2e650c7/"
style="text-decoration: none; font-size: 10px; margin: 0;"
>
<img src="https://pikwizard.com/pw/medium/ffe9dd70a772d0cf052d49d8b2e650c7.jpg" style="margin: 0; width: 100%;" alt="" />
<p style="font-size: 12px; margin: 0;">PikWizard</p>
</a>
</span>
</span>
Free (free of charge)
Free for personal and commercial use.
Author: Creative Art
Similar Free Stock Images

Premium


Premium

Premium


Premium

Premium


Premium

Premium

Premium


Premium


Premium

Premium


Premium

Premium


Premium


Premium


Premium


Premium


Premium


Premium


Premium


Premium


Premium


Premium

Premium


Premium


Explore More Free Stock Images