- Home >
- Stock Photos >
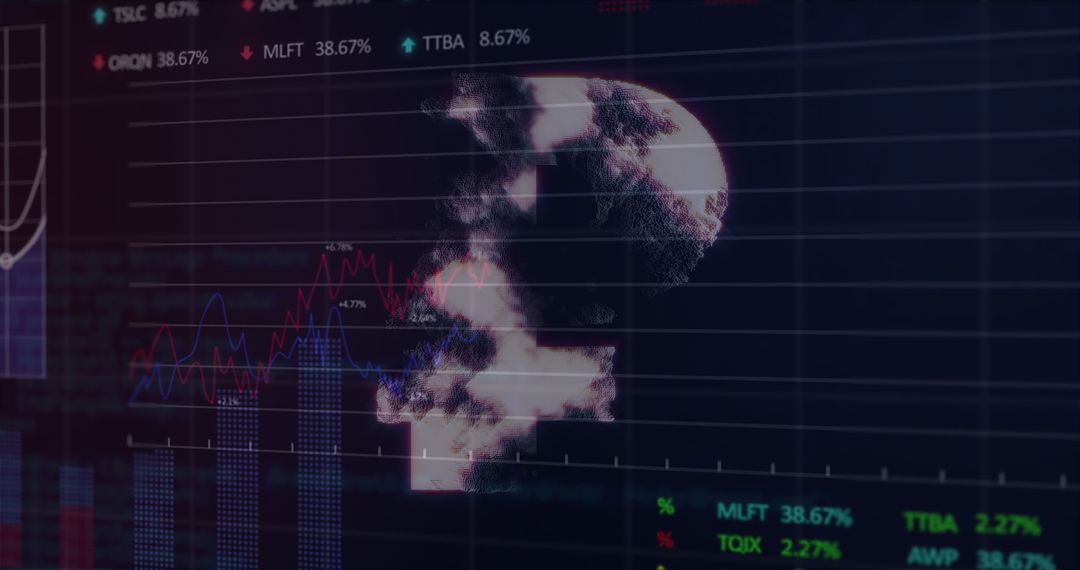
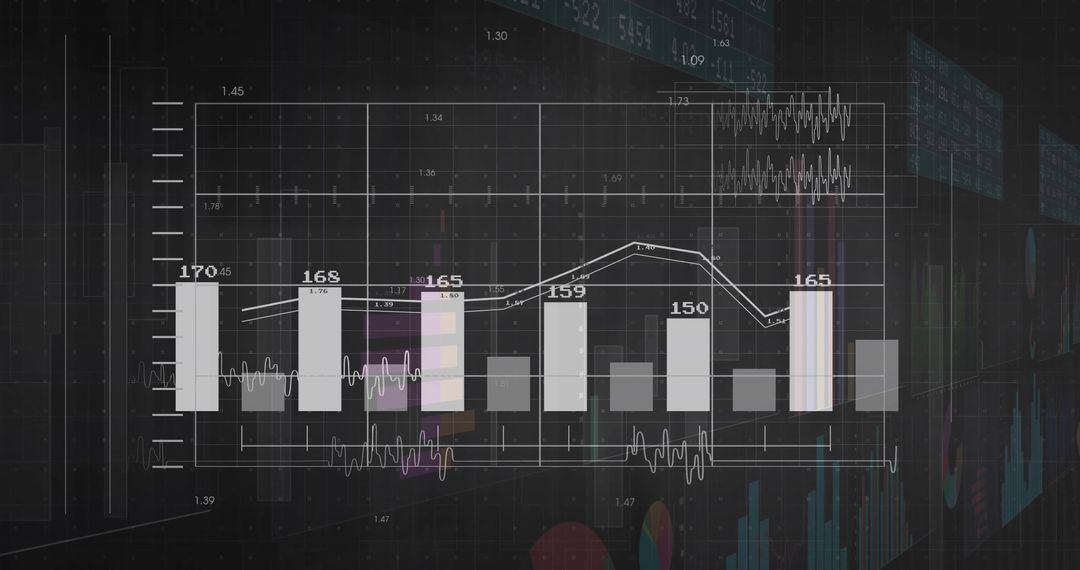
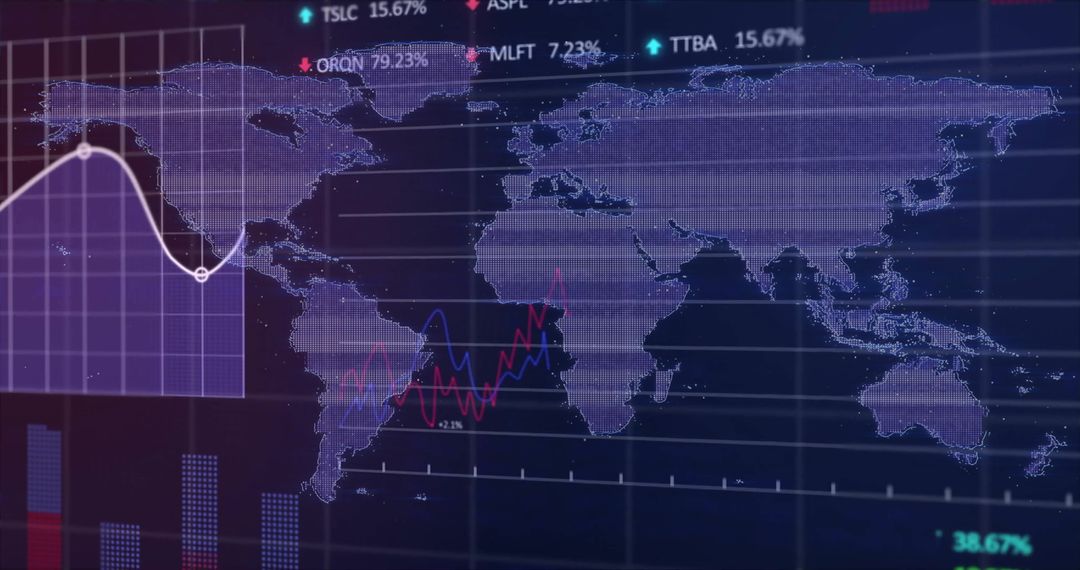
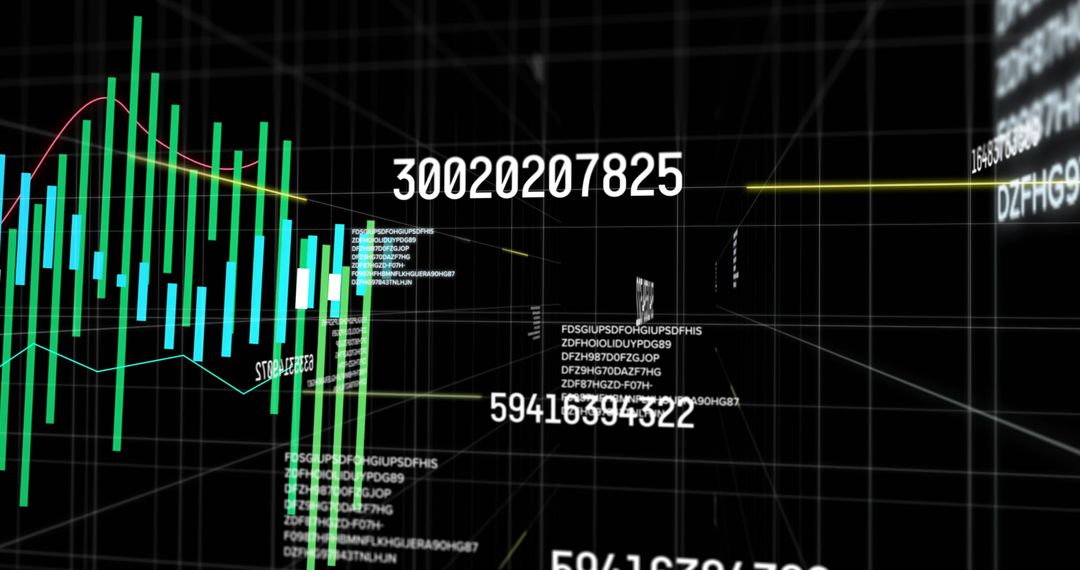
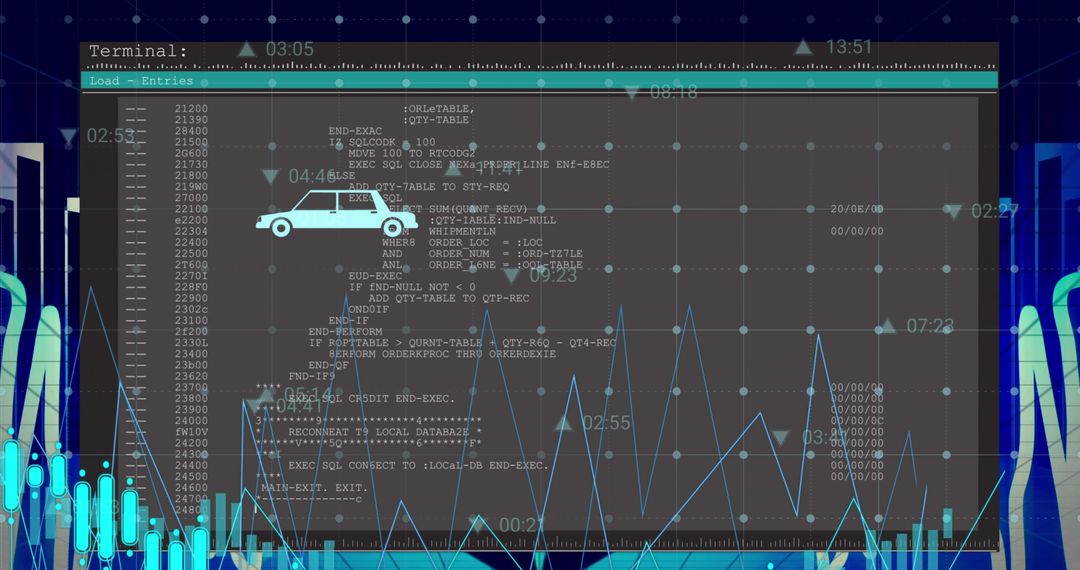
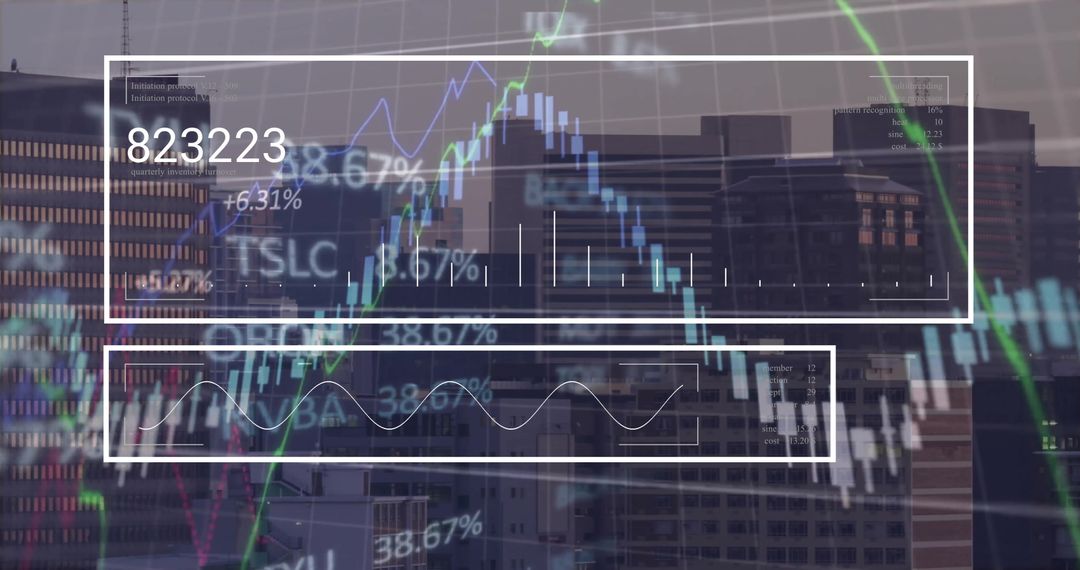
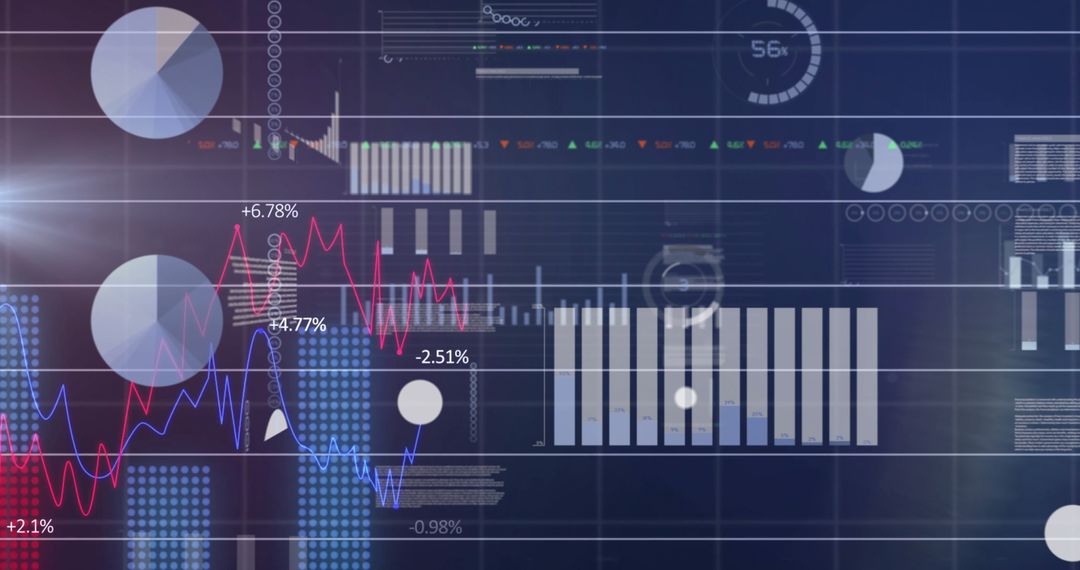
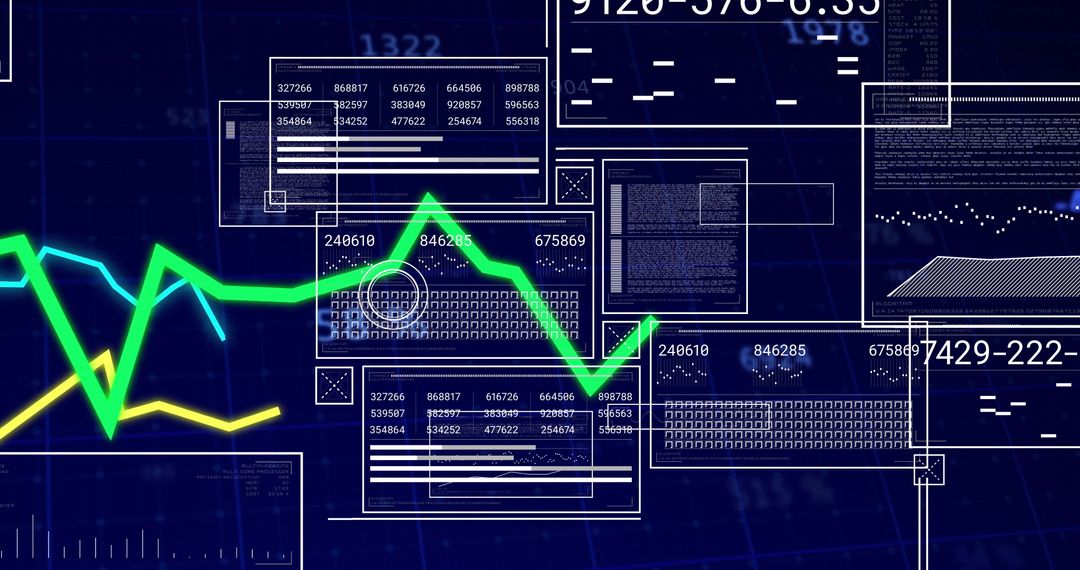
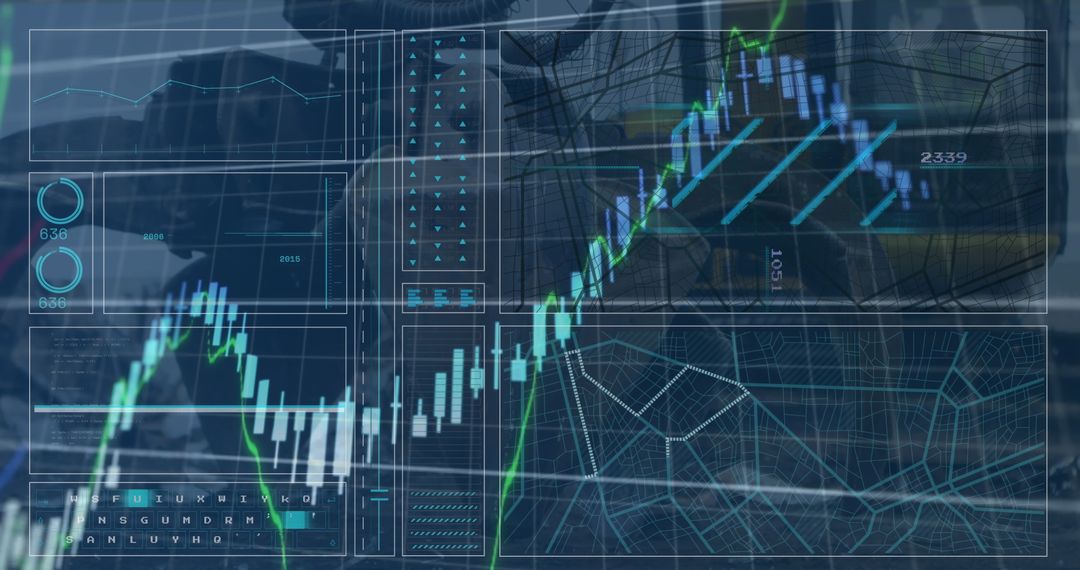
- Financial Data Analysis Dashboard with Charts and World Map
Financial Data Analysis Dashboard with Charts and World Map Image

Corporate and financial presentations can utilize this image to illustrate market trends and global analytics. Suitable for banner visuals in articles that discuss financial investment strategies and data technology advancements. Solution providers in finance technology can use it to depict their software capabilities in analyzing and trading international markets.
Powered by 


2
downloads
downloads
Tags:
More
Credit Photo
If you would like to credit the Photo, here are some ways you can do so
Text Link
photo Link
<span class="text-link">
<span>
<a target="_blank" href=https://pikwizard.com/photo/financial-data-analysis-dashboard-with-charts-and-world-map/735ed5719c151937d1346a716c5565b3/>PikWizard</a>
</span>
</span>
<span class="image-link">
<span
style="margin: 0 0 20px 0; display: inline-block; vertical-align: middle; width: 100%;"
>
<a
target="_blank"
href="https://pikwizard.com/photo/financial-data-analysis-dashboard-with-charts-and-world-map/735ed5719c151937d1346a716c5565b3/"
style="text-decoration: none; font-size: 10px; margin: 0;"
>
<img src="https://pikwizard.com/pw/medium/735ed5719c151937d1346a716c5565b3.jpg" style="margin: 0; width: 100%;" alt="" />
<p style="font-size: 12px; margin: 0;">PikWizard</p>
</a>
</span>
</span>
Free (free of charge)
Free for personal and commercial use.
Author: Authentic Images