- Home >
- Stock Photos >
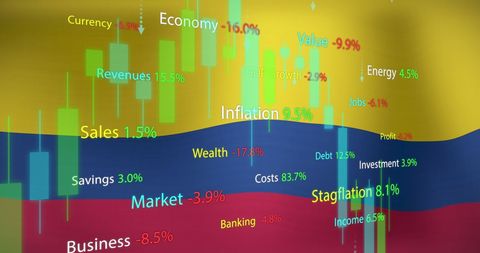
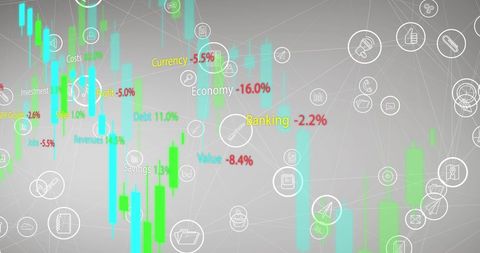
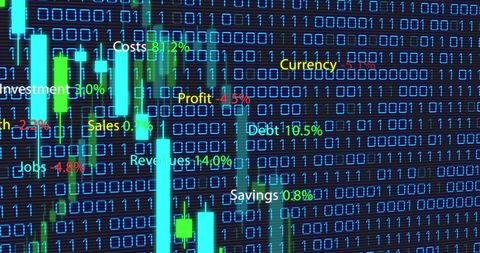
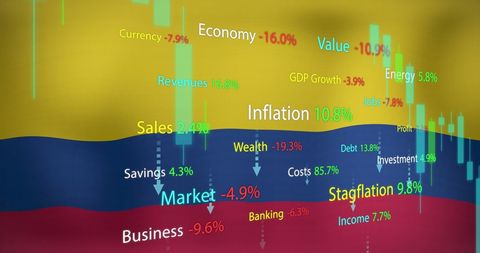
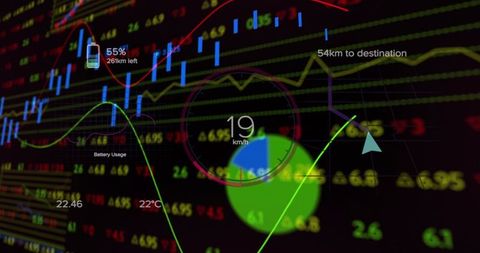
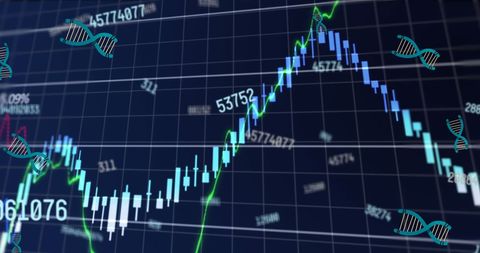
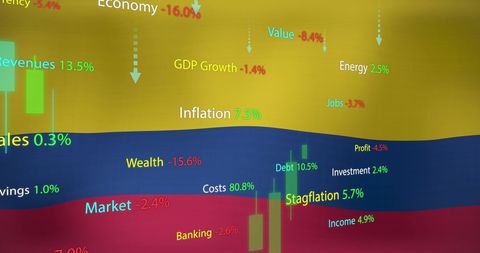
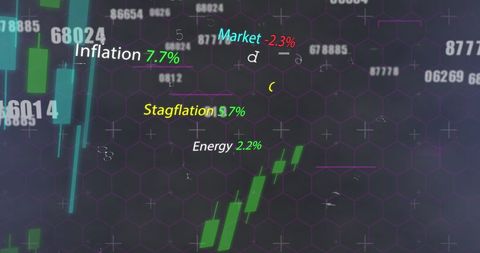
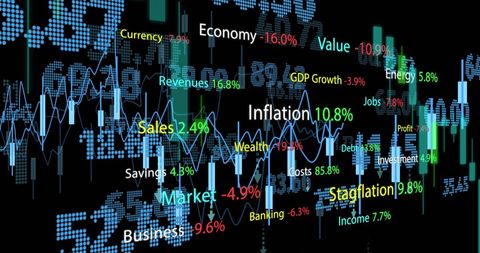
- Financial Data Analysis Depicting Economic Indicators and Trends
Financial Data Analysis Depicting Economic Indicators and Trends Image

Illustrates various economic indicators, providing an insight into global finance and business economics. Displays fluctuating percentages related to key indicators like inflation, GDP growth, market activity, and more. Useful for financial presentations, economic concept demos, finance articles, or business analytics content. Can aid in conveying complex financial data visually or enhancing investment-related discussions.
Powered by  - Get 15% off with code: PIKWIZARD15


downloads
Tags:
More
Credit Photo
If you would like to credit the Photo, here are some ways you can do so
Text Link
photo Link
<span class="text-link">
<span>
<a target="_blank" href=https://pikwizard.com/photo/financial-data-analysis-depicting-economic-indicators-and-trends/f12d4ef71369bdfd9c38af36328e73dc/>PikWizard</a>
</span>
</span>
<span class="image-link">
<span
style="margin: 0 0 20px 0; display: inline-block; vertical-align: middle; width: 100%;"
>
<a
target="_blank"
href="https://pikwizard.com/photo/financial-data-analysis-depicting-economic-indicators-and-trends/f12d4ef71369bdfd9c38af36328e73dc/"
style="text-decoration: none; font-size: 10px; margin: 0;"
>
<img src="https://pikwizard.com/pw/medium/f12d4ef71369bdfd9c38af36328e73dc.jpg" style="margin: 0; width: 100%;" alt="" />
<p style="font-size: 12px; margin: 0;">PikWizard</p>
</a>
</span>
</span>
Free (free of charge)
Free for personal and commercial use.
Author: Creative Art
Similar Free Stock Images
Loading...

Premium


Premium

Premium


Premium

Premium

Premium


Premium


Premium


Premium
Premium


Premium


Premium
Premium


Premium

Premium

Premium


Premium


Premium


Premium

Premium


Premium


Premium


Premium


Premium


Premium