
- Home >
- Stock Photos >
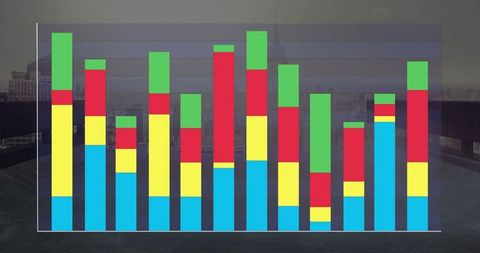
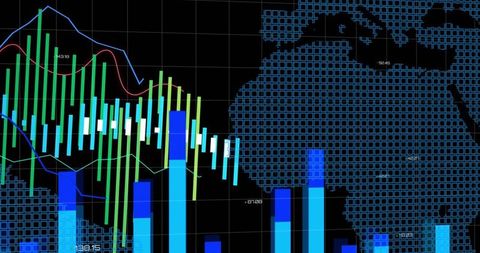
- Financial Data Analysis Display with Colorful Graphs
Financial Data Analysis Display with Colorful Graphs Image

Colorful bar graphs and line charts overlaying a digital interface design display financial statistics. This image is ideal for presenting financial analyses, reports, or business presentations that emphasize market trends and data-driven decisions. It serves well in contexts discussing economic strategies, data processing technologies, or illustrating stock market dynamics and forecasts.
Powered by  - Get 15% off with code: PIKWIZARD15


downloads
Tags:
More
Credit Photo
If you would like to credit the Photo, here are some ways you can do so
Text Link
photo Link
<span class="text-link">
<span>
<a target="_blank" href=https://pikwizard.com/photo/financial-data-analysis-display-with-colorful-graphs/8db889a32cf8e3e28fc304d02f249c52/>PikWizard</a>
</span>
</span>
<span class="image-link">
<span
style="margin: 0 0 20px 0; display: inline-block; vertical-align: middle; width: 100%;"
>
<a
target="_blank"
href="https://pikwizard.com/photo/financial-data-analysis-display-with-colorful-graphs/8db889a32cf8e3e28fc304d02f249c52/"
style="text-decoration: none; font-size: 10px; margin: 0;"
>
<img src="https://pikwizard.com/pw/medium/8db889a32cf8e3e28fc304d02f249c52.jpg" style="margin: 0; width: 100%;" alt="" />
<p style="font-size: 12px; margin: 0;">PikWizard</p>
</a>
</span>
</span>
Free (free of charge)
Free for personal and commercial use.
Author: Creative Art
Similar Free Stock Images

Premium


Premium

Premium


Premium


Premium


Premium

Premium

Premium


Premium


Premium

Premium


Premium


Premium


Premium

Premium


Premium


Premium

Premium


Premium


Premium


Premium


Premium

Premium

Premium


Premium


Explore More Free Stock Images