- Home >
- Stock Photos >
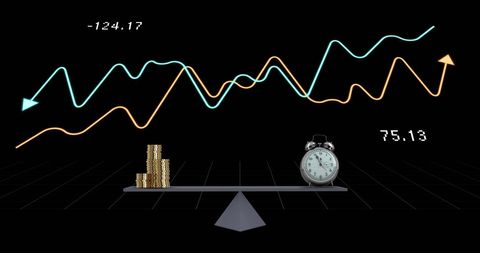
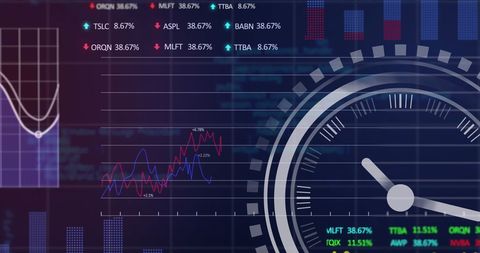
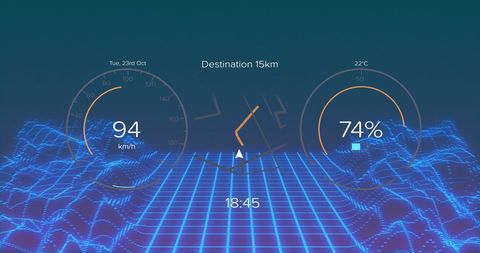
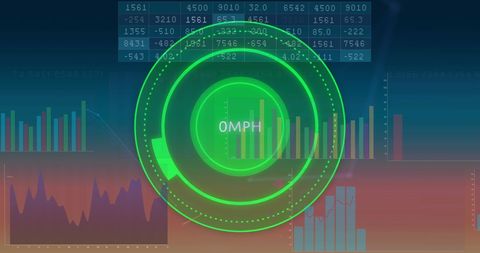
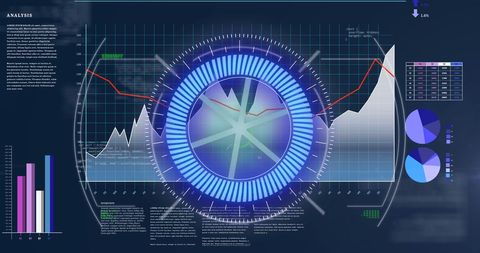
- Financial Data Analysis Dynamic Interface with Virtual Radar
Financial Data Analysis Dynamic Interface with Virtual Radar Image

A dynamic visual of financial data with virtual radar interface suggests a futuristic theme for business analytics. Ideal for illustrating topics in finance, technology, or data analysis. Useful for presentations, articles on market forecasting, or advertising tech-based financial products.

downloads
Tags:
More
Credit Photo
If you would like to credit the Photo, here are some ways you can do so
Text Link
photo Link
<span class="text-link">
<span>
<a target="_blank" href=https://pikwizard.com/photo/financial-data-analysis-dynamic-interface-with-virtual-radar/72eaaf80e680874d6c21977f2aff8a4e/>PikWizard</a>
</span>
</span>
<span class="image-link">
<span
style="margin: 0 0 20px 0; display: inline-block; vertical-align: middle; width: 100%;"
>
<a
target="_blank"
href="https://pikwizard.com/photo/financial-data-analysis-dynamic-interface-with-virtual-radar/72eaaf80e680874d6c21977f2aff8a4e/"
style="text-decoration: none; font-size: 10px; margin: 0;"
>
<img src="https://pikwizard.com/pw/medium/72eaaf80e680874d6c21977f2aff8a4e.jpg" style="margin: 0; width: 100%;" alt="" />
<p style="font-size: 12px; margin: 0;">PikWizard</p>
</a>
</span>
</span>
Free (free of charge)
Free for personal and commercial use.
Author: Authentic Images