
- Home >
- Stock Photos >
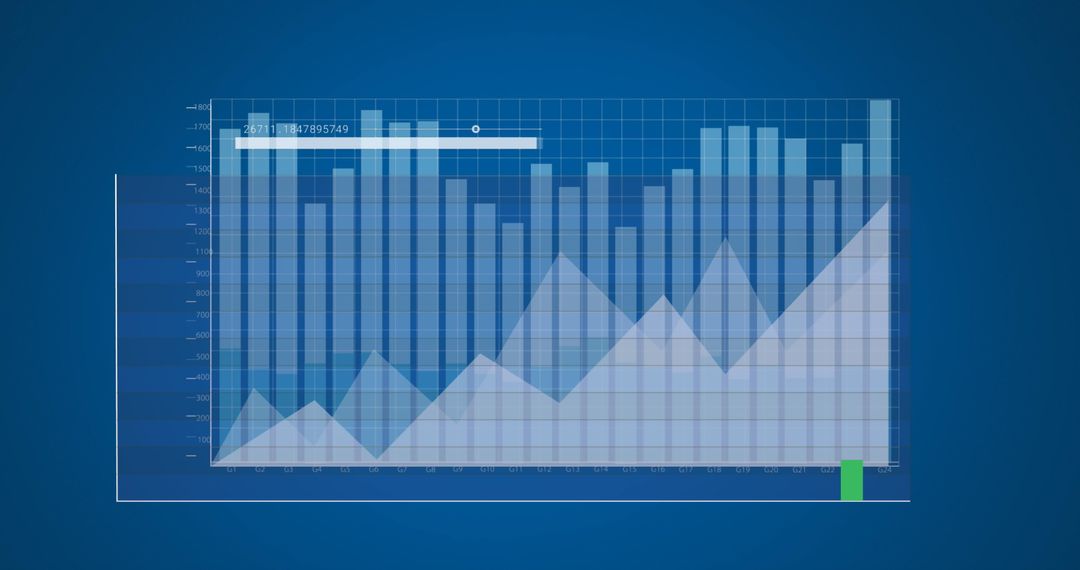
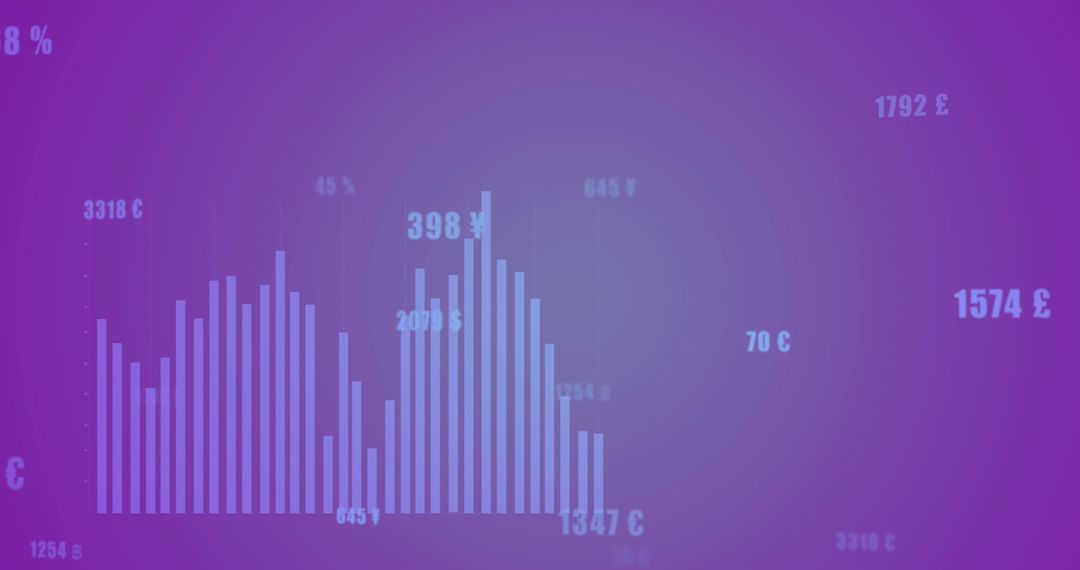
- Financial Data Analysis Graph on Blue Background Concept
Financial Data Analysis Graph on Blue Background Concept Image

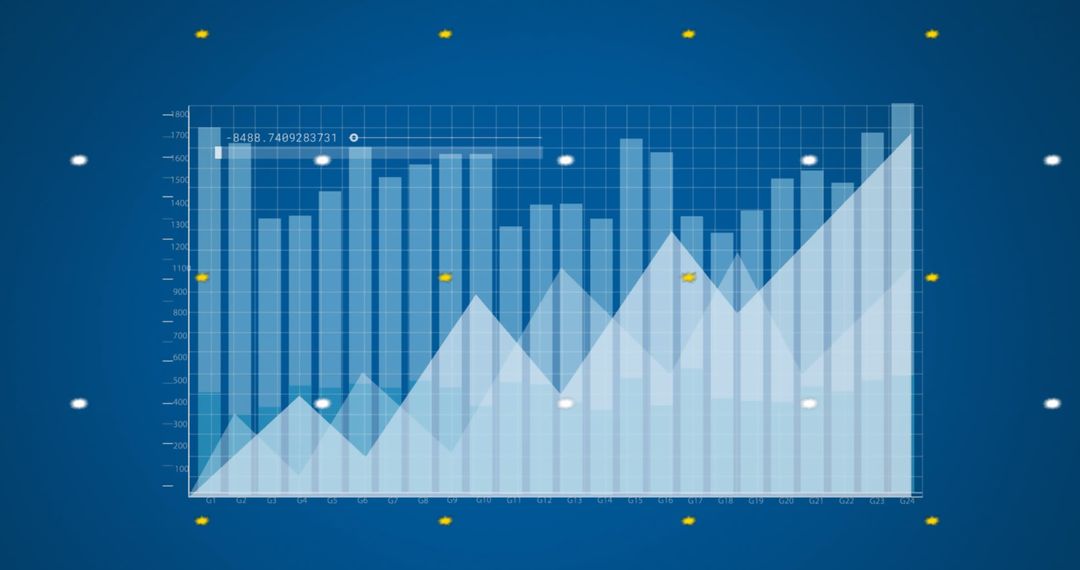
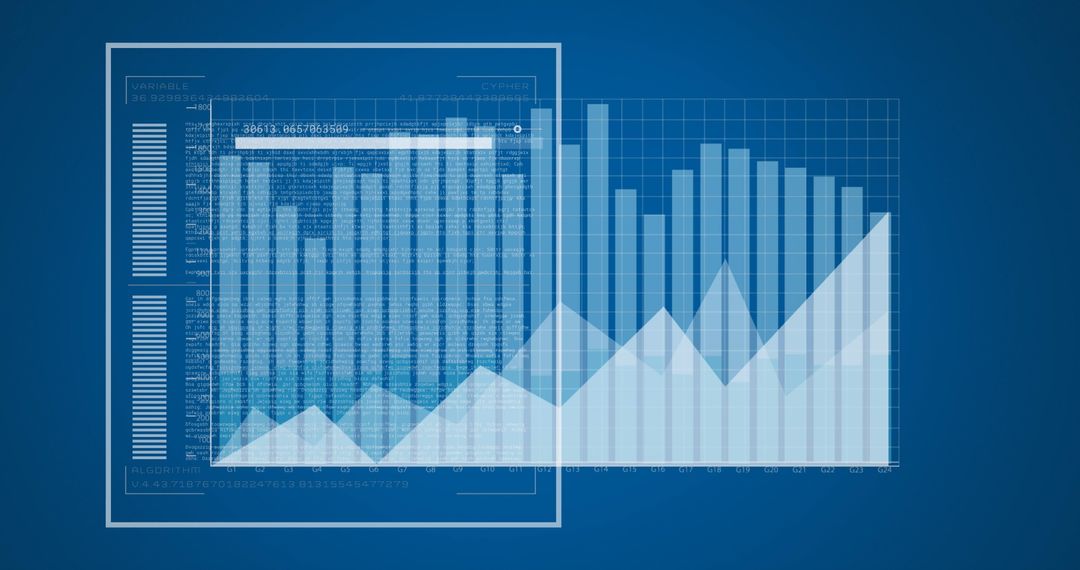
Graph depicts financial data analysis against a blue backdrop, showcasing trends and growth stats through a bar and line graph hologram. Great for illustrating business reports, financial presentations, economic studies, or any content related to global finance and digital data processing.
Powered by  - Get 15% off with code: PIKWIZARD15


2
downloads
downloads
Tags:
More
Credit Photo
If you would like to credit the Photo, here are some ways you can do so
Text Link
photo Link
<span class="text-link">
<span>
<a target="_blank" href=https://pikwizard.com/photo/financial-data-analysis-graph-on-blue-background-concept/18398d6a9e3c897a2a9b9b638e40f893/>PikWizard</a>
</span>
</span>
<span class="image-link">
<span
style="margin: 0 0 20px 0; display: inline-block; vertical-align: middle; width: 100%;"
>
<a
target="_blank"
href="https://pikwizard.com/photo/financial-data-analysis-graph-on-blue-background-concept/18398d6a9e3c897a2a9b9b638e40f893/"
style="text-decoration: none; font-size: 10px; margin: 0;"
>
<img src="https://pikwizard.com/pw/medium/18398d6a9e3c897a2a9b9b638e40f893.jpg" style="margin: 0; width: 100%;" alt="" />
<p style="font-size: 12px; margin: 0;">PikWizard</p>
</a>
</span>
</span>
Free (free of charge)
Free for personal and commercial use.
Author: Awesome Content
Similar Free Stock Images

Premium


Premium


Premium


Premium


Premium


Premium


Premium


Premium


Premium


Premium


Premium


Premium


Premium


Premium


Premium


Premium


Premium


Premium


Premium


Premium


Premium


Premium


Premium


Premium

