- Home >
- Stock Photos >
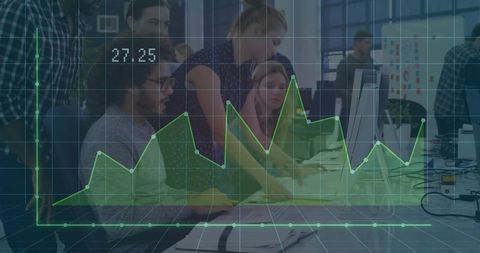
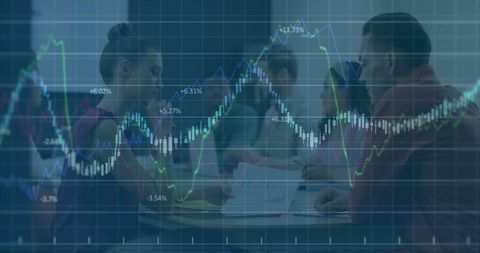
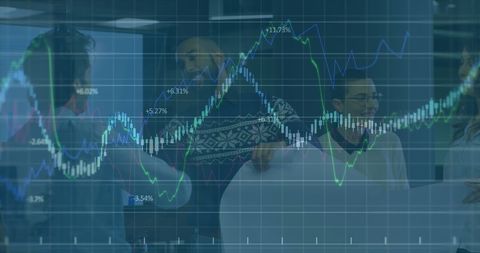
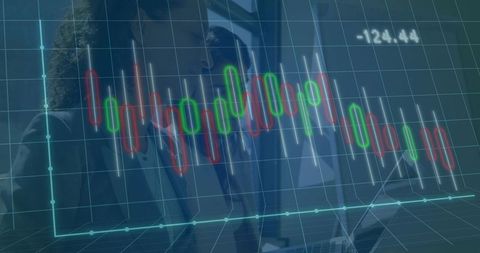
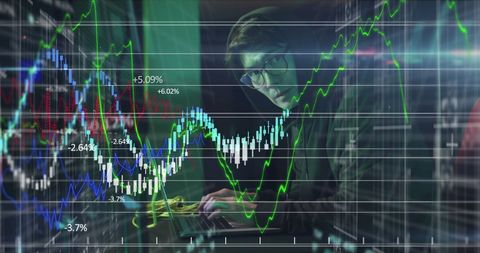
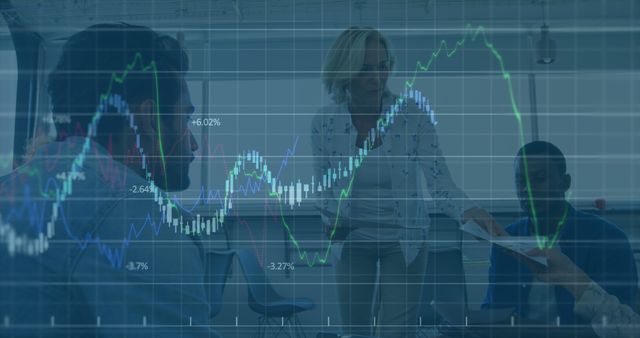
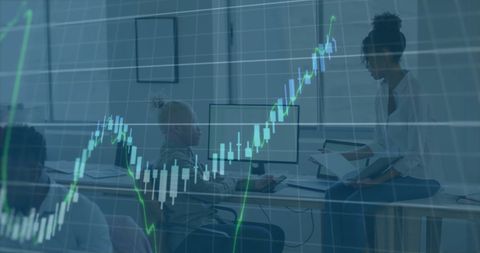
- Financial Data Analysis in Modern Server Room Environment
Financial Data Analysis in Modern Server Room Environment Image

A businessman working on financial data analysis is surrounded by a digital interface filled with complex graphs and charts in a server room. This concept illustrates the intersection of finance, technology, and global business, highlighting the analytical aspect of stock market trends. Useful for illustrating topics related to finance, digital data evaluation, and technological advancements in a corporate setting.

downloads
Tags:
More
Credit Photo
If you would like to credit the Photo, here are some ways you can do so
Text Link
photo Link
<span class="text-link">
<span>
<a target="_blank" href=https://pikwizard.com/photo/financial-data-analysis-in-modern-server-room-environment/e2d5ae0910cd299494a4cfd34a8e8b55/>PikWizard</a>
</span>
</span>
<span class="image-link">
<span
style="margin: 0 0 20px 0; display: inline-block; vertical-align: middle; width: 100%;"
>
<a
target="_blank"
href="https://pikwizard.com/photo/financial-data-analysis-in-modern-server-room-environment/e2d5ae0910cd299494a4cfd34a8e8b55/"
style="text-decoration: none; font-size: 10px; margin: 0;"
>
<img src="https://pikwizard.com/pw/medium/e2d5ae0910cd299494a4cfd34a8e8b55.jpg" style="margin: 0; width: 100%;" alt="" />
<p style="font-size: 12px; margin: 0;">PikWizard</p>
</a>
</span>
</span>
Free (free of charge)
Free for personal and commercial use.
Author: Authentic Images