
- Home >
- Stock Photos >
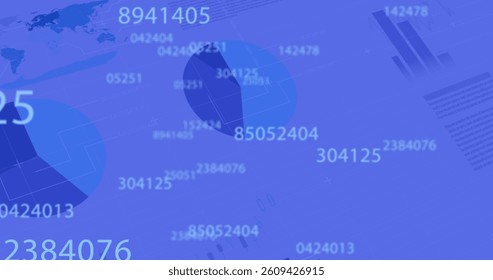
- Financial Data Analysis on Blue Global Network
Financial Data Analysis on Blue Global Network Image

Visual representing digital financial analysis on a global scale. Ideal for articles, presentations, and reports on finance, technology, or data processing in commerce and industry. Useful for illustrating digital age concepts, global finance discussions, and technological advancements in economics and business studies.
Powered by  - Get 15% off with code: PIKWIZARD15


downloads
Tags:
More
Credit Photo
If you would like to credit the Photo, here are some ways you can do so
Text Link
photo Link
<span class="text-link">
<span>
<a target="_blank" href=https://pikwizard.com/photo/financial-data-analysis-on-blue-global-network/f7288b357d072b6d147a5f549a057234/>PikWizard</a>
</span>
</span>
<span class="image-link">
<span
style="margin: 0 0 20px 0; display: inline-block; vertical-align: middle; width: 100%;"
>
<a
target="_blank"
href="https://pikwizard.com/photo/financial-data-analysis-on-blue-global-network/f7288b357d072b6d147a5f549a057234/"
style="text-decoration: none; font-size: 10px; margin: 0;"
>
<img src="https://pikwizard.com/pw/medium/f7288b357d072b6d147a5f549a057234.jpg" style="margin: 0; width: 100%;" alt="" />
<p style="font-size: 12px; margin: 0;">PikWizard</p>
</a>
</span>
</span>
Free (free of charge)
Free for personal and commercial use.
Author: Creative Art
Similar Free Stock Images

Premium


Premium

Premium


Premium


Premium


Premium


Premium

Premium


Premium

Premium


Premium

Premium


AI


Premium

Premium


Premium

Premium


Premium


Premium


Premium


Premium


Premium


Premium

Premium


Premium

Premium


Explore More Free Stock Images