- Home >
- Stock Photos >
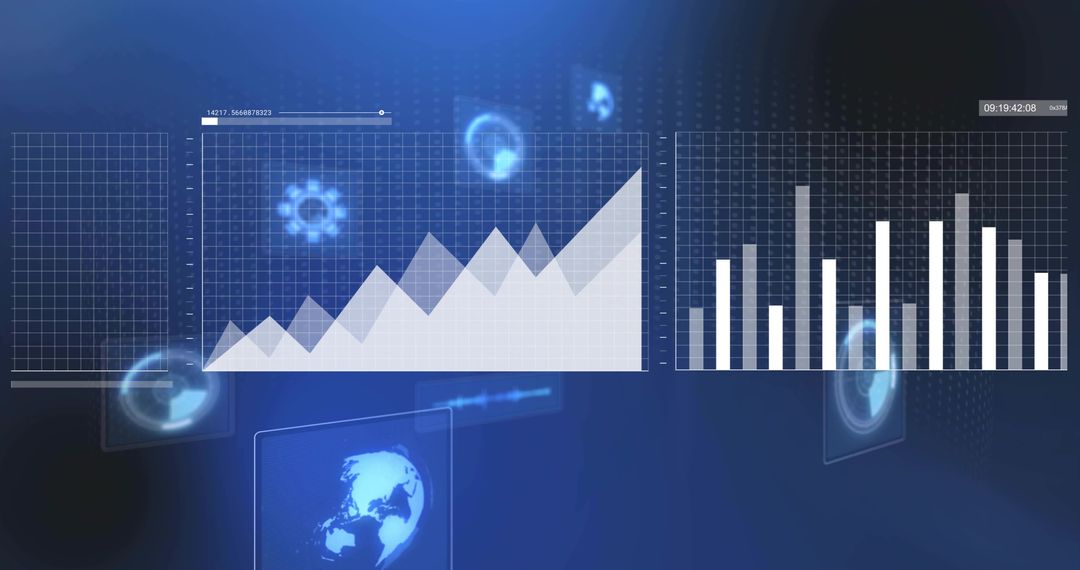
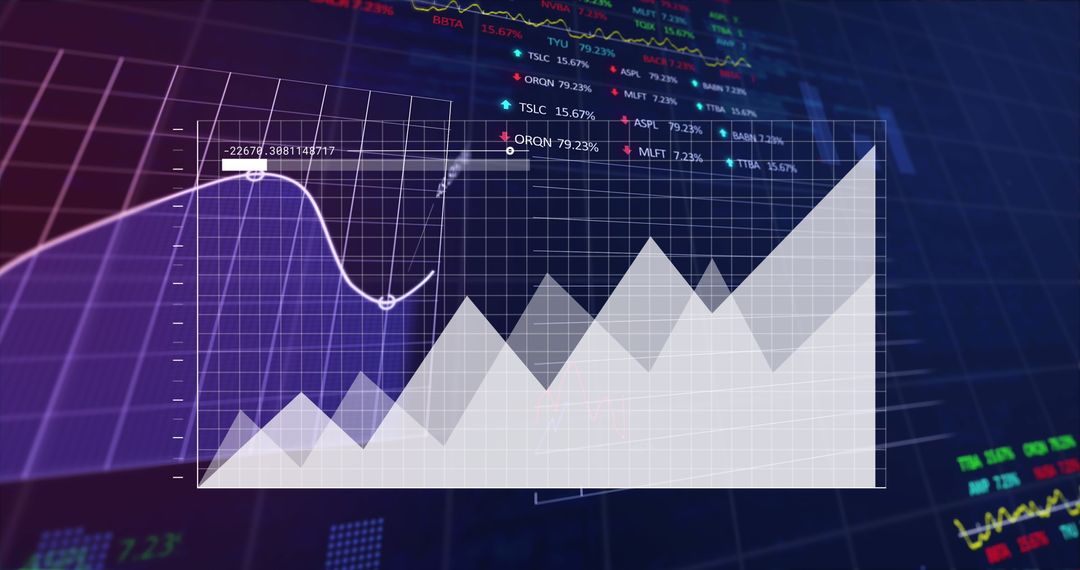
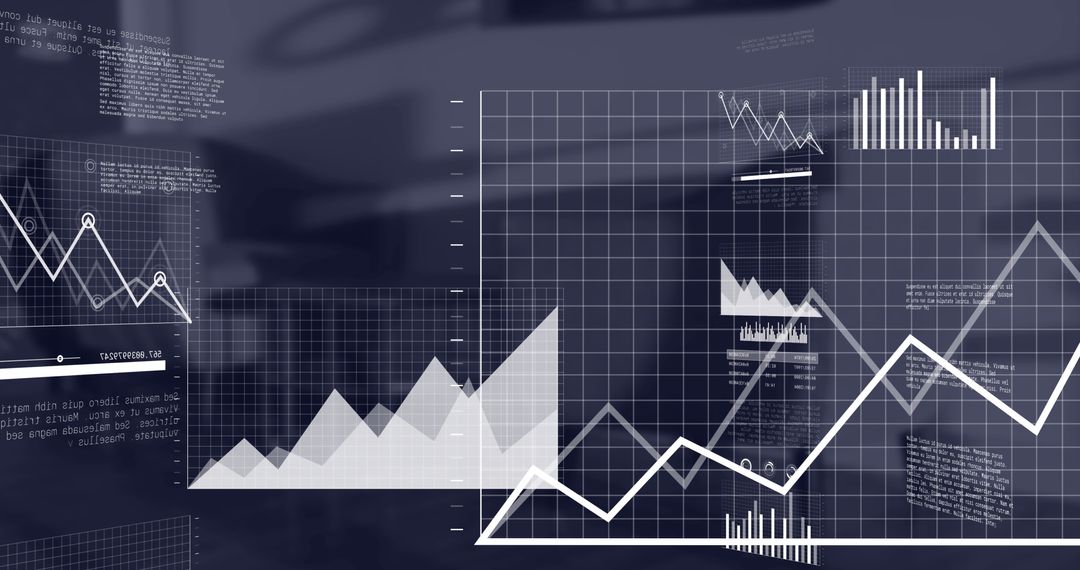
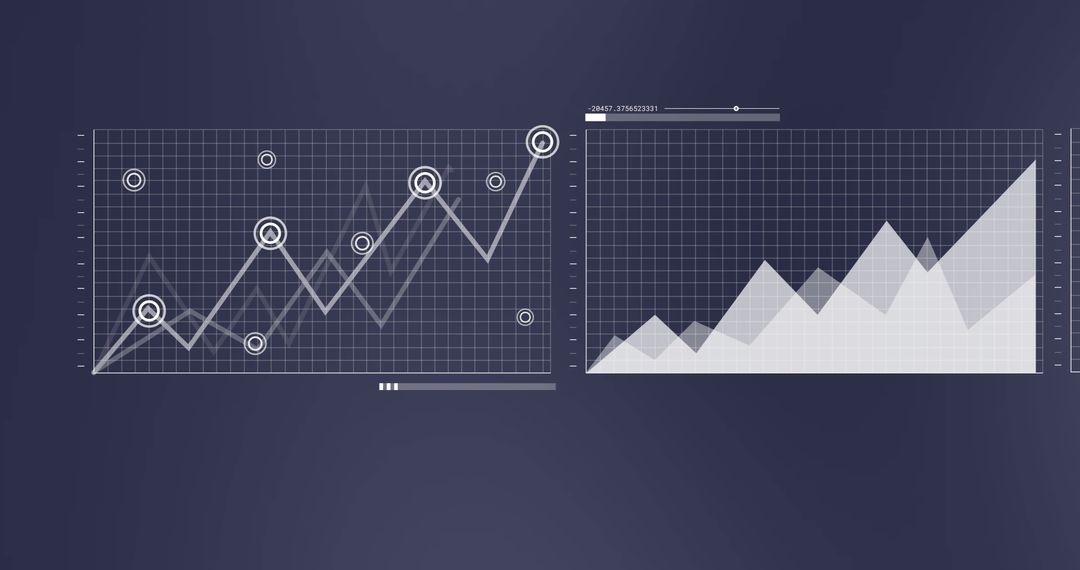
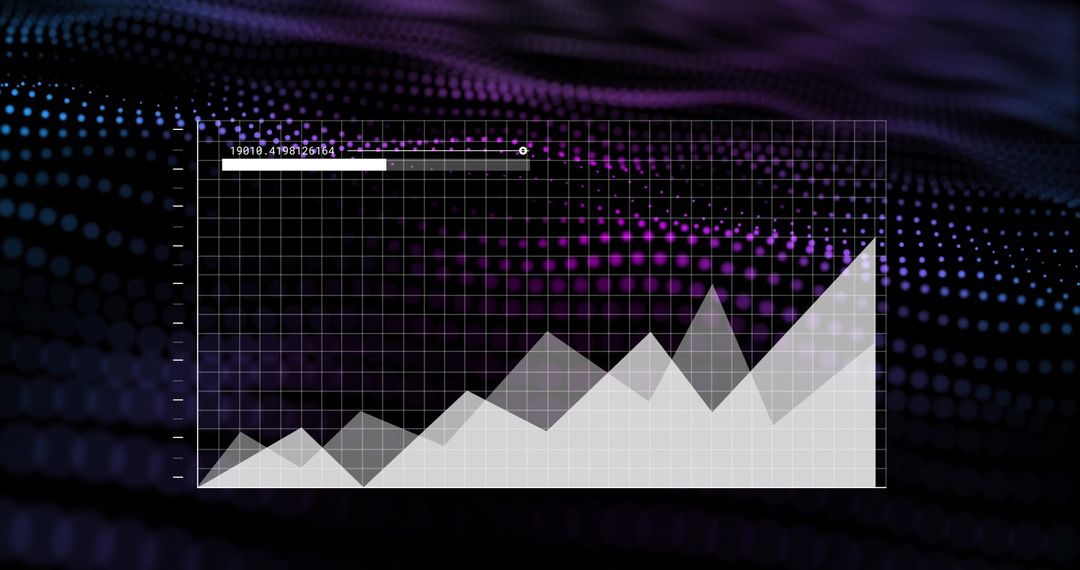
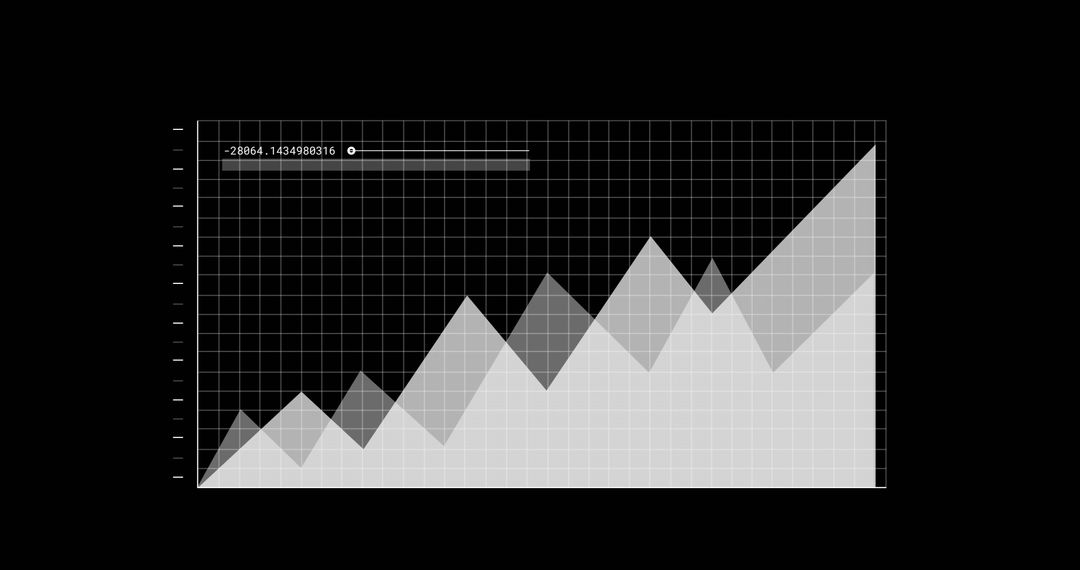
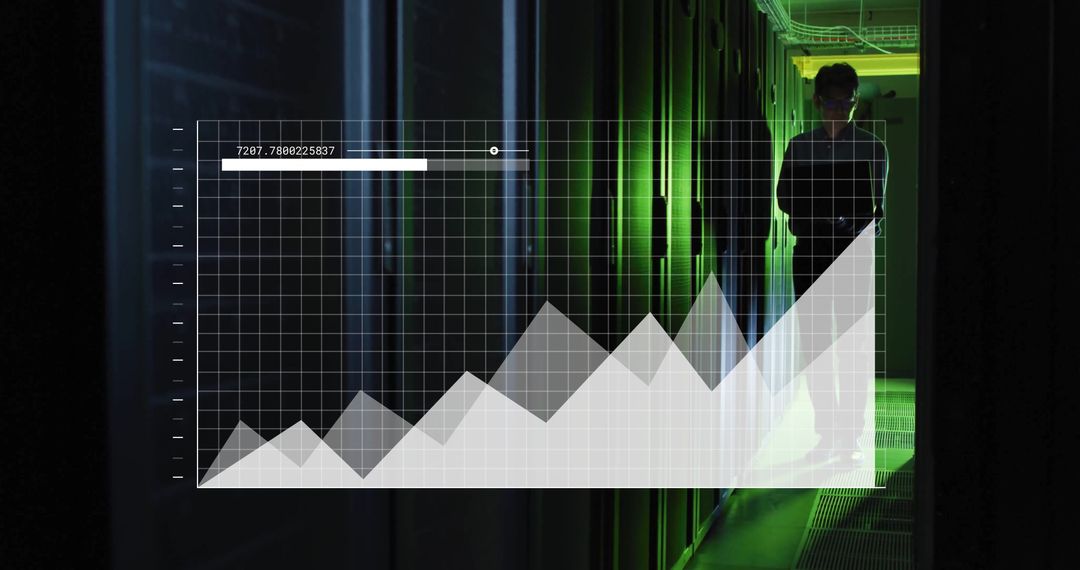
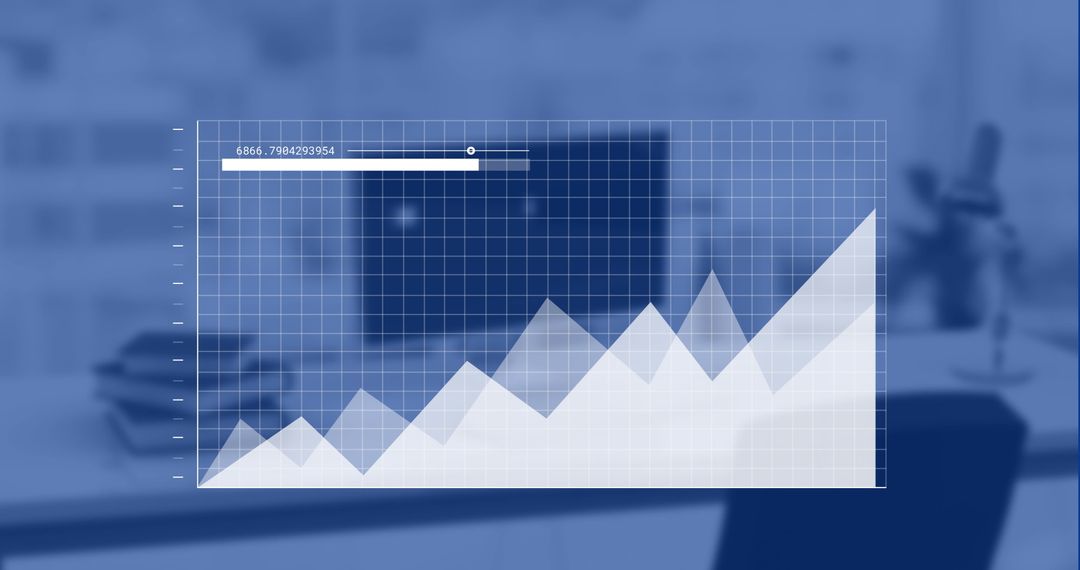
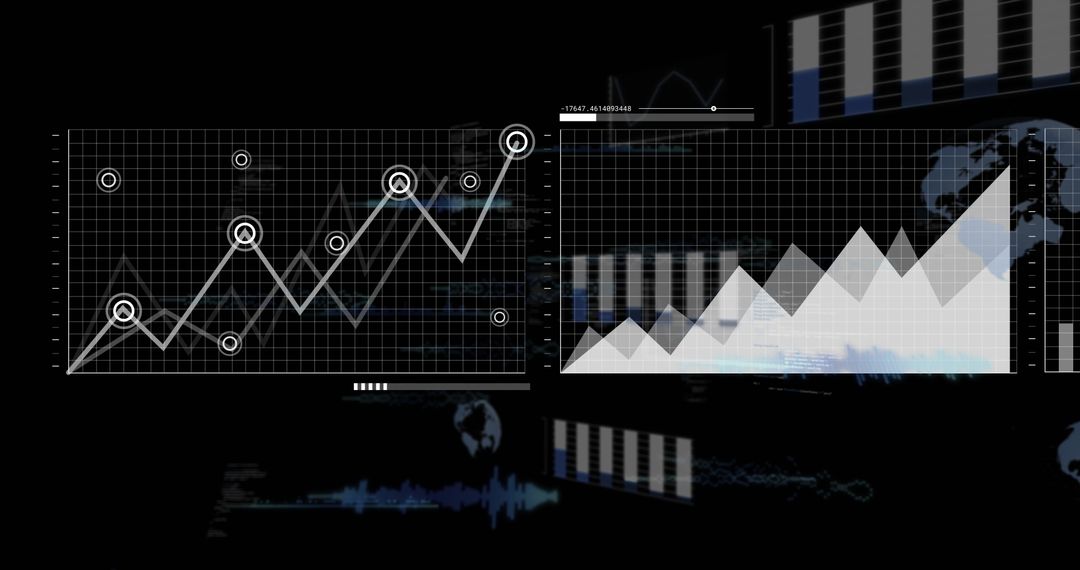
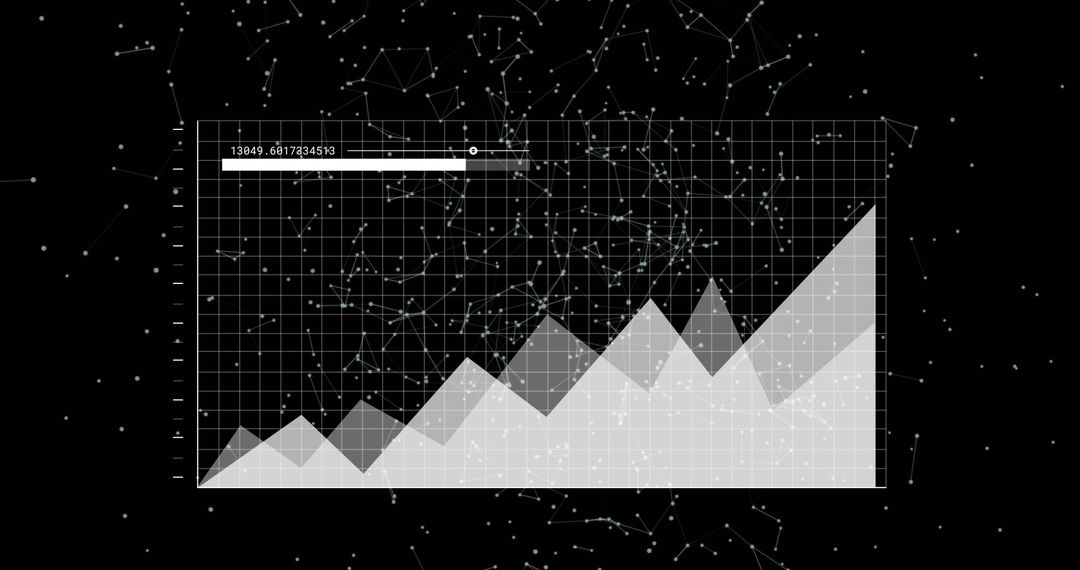
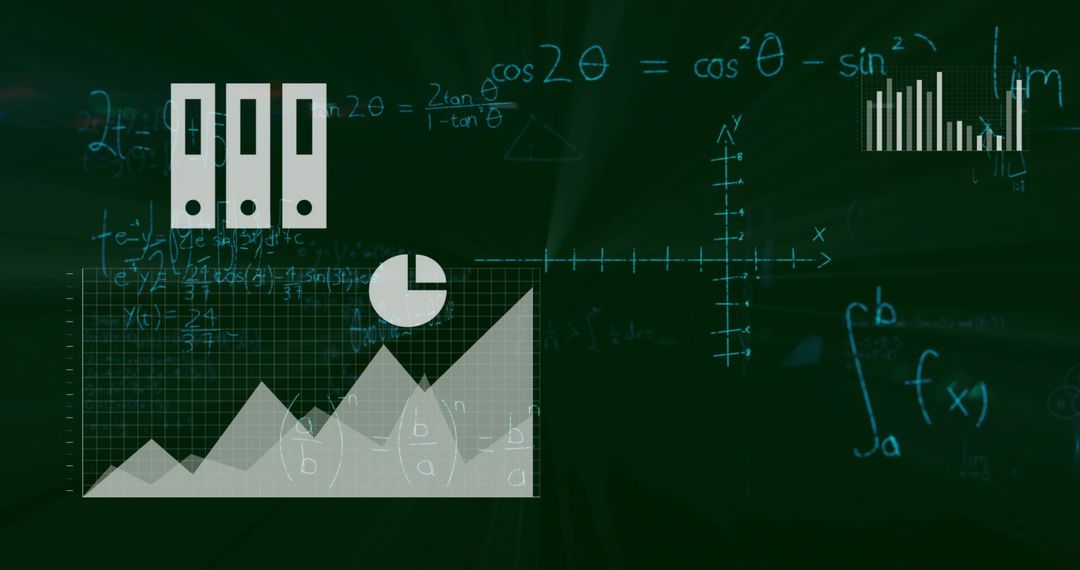
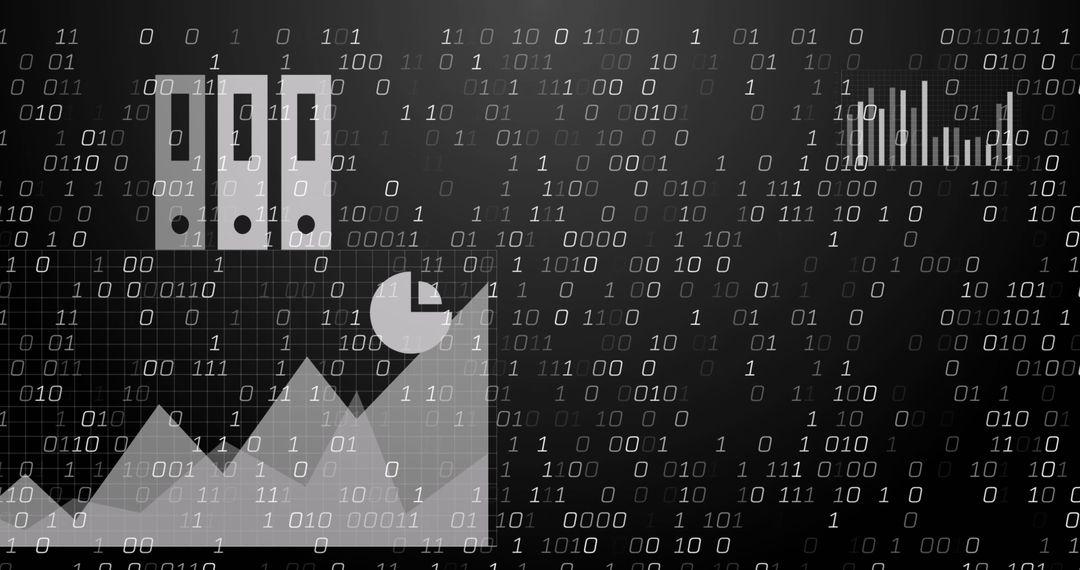
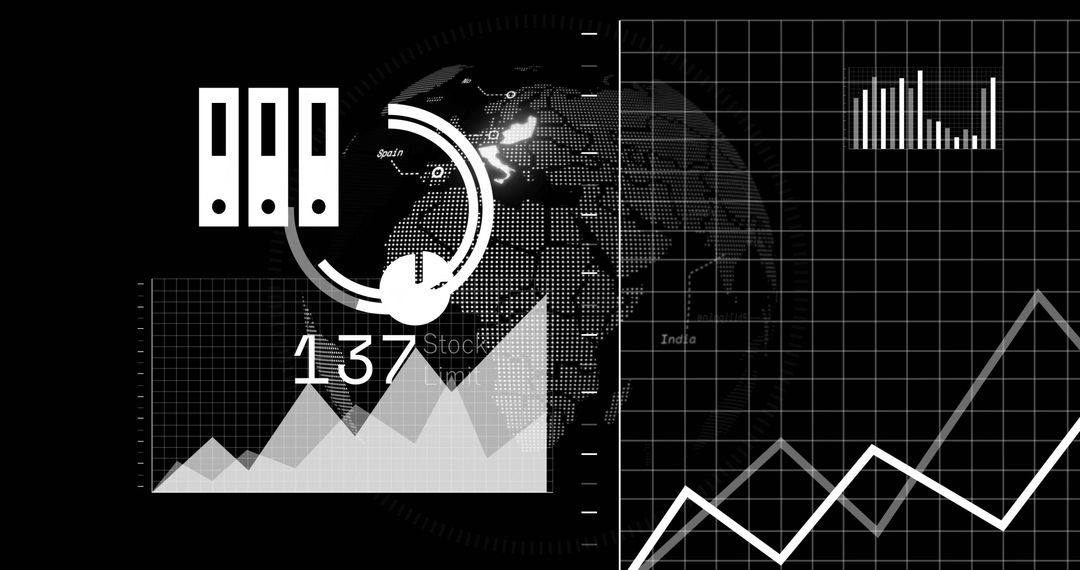
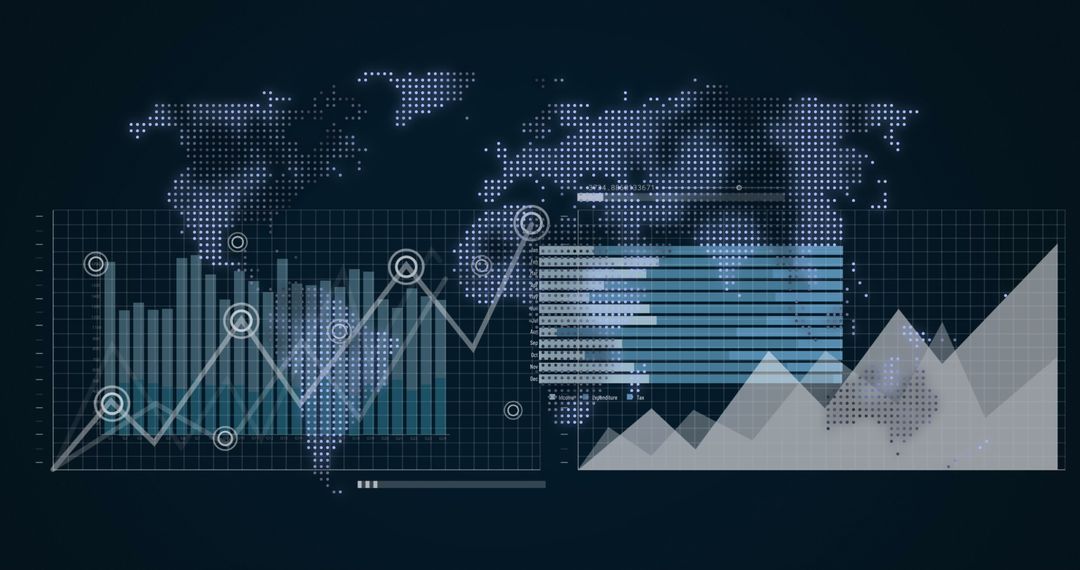
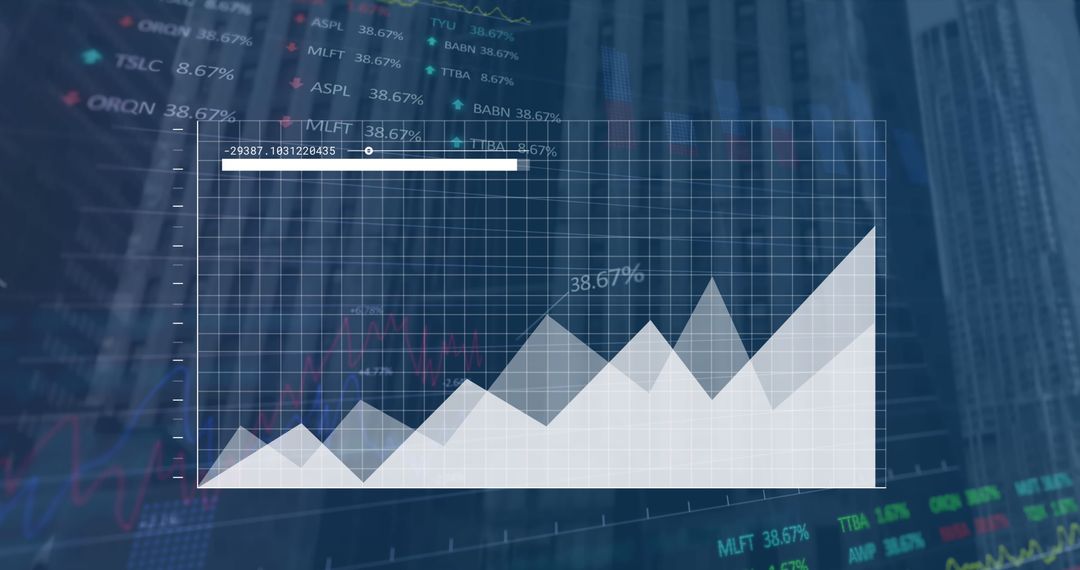
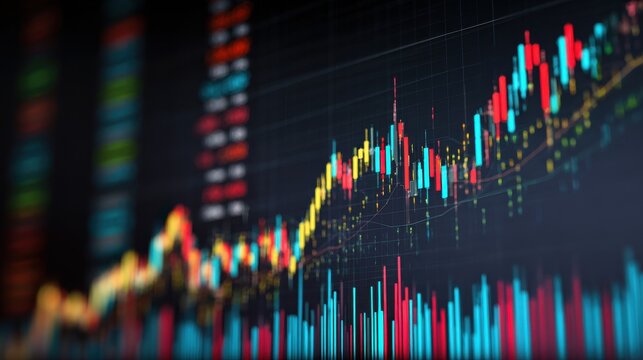
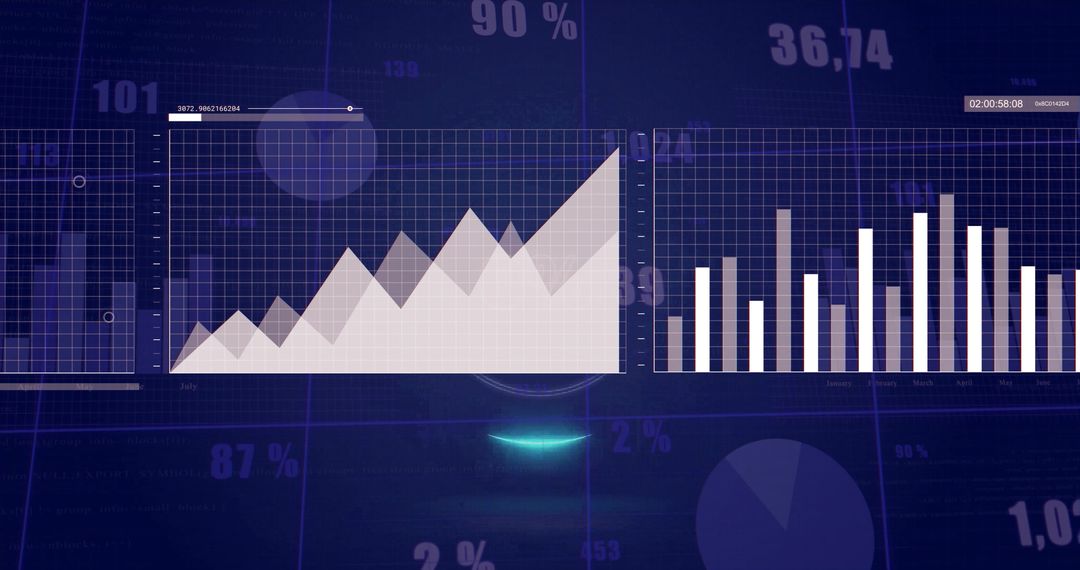
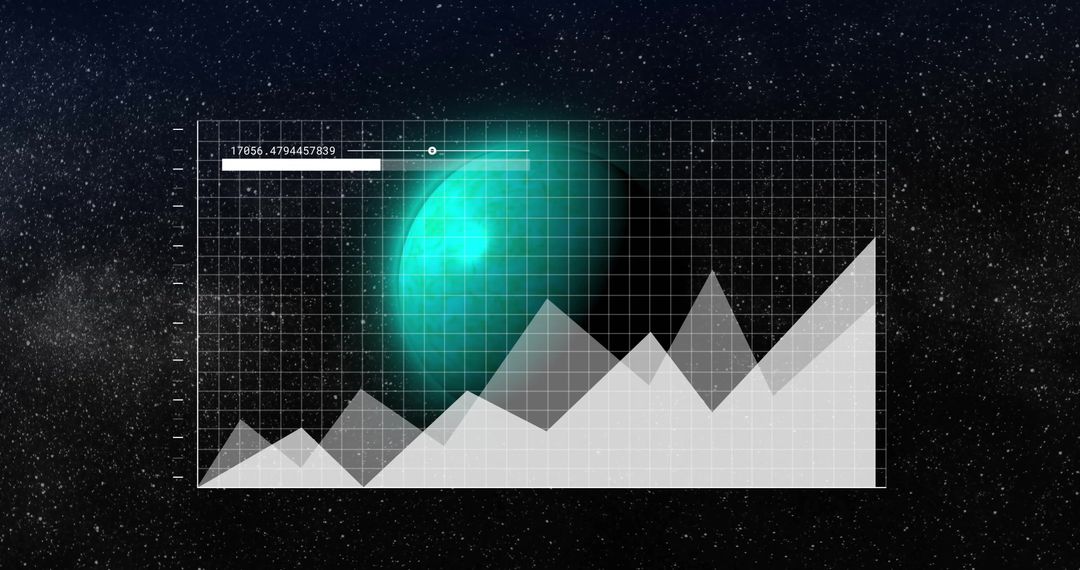
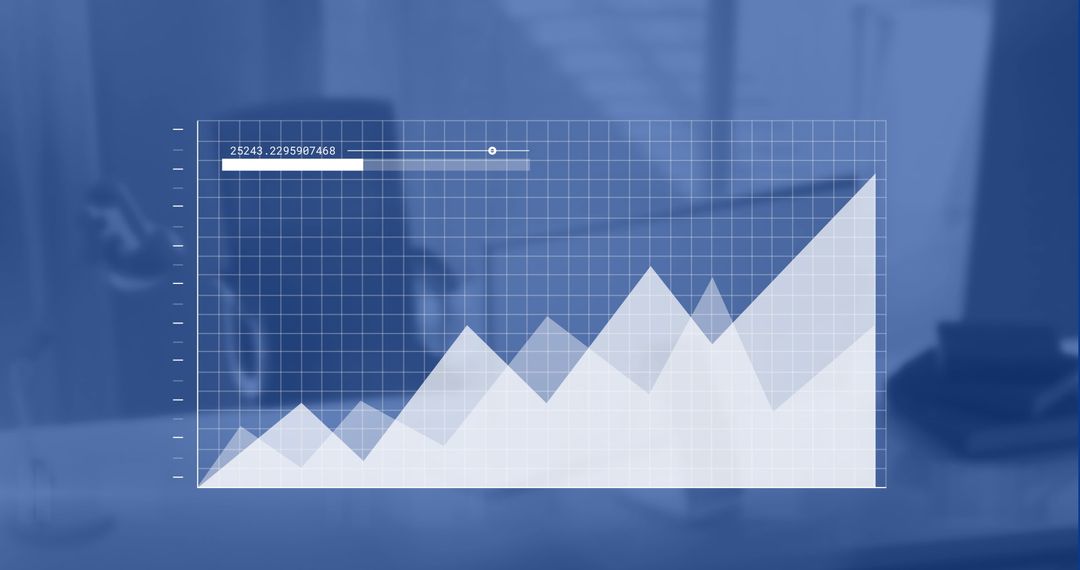
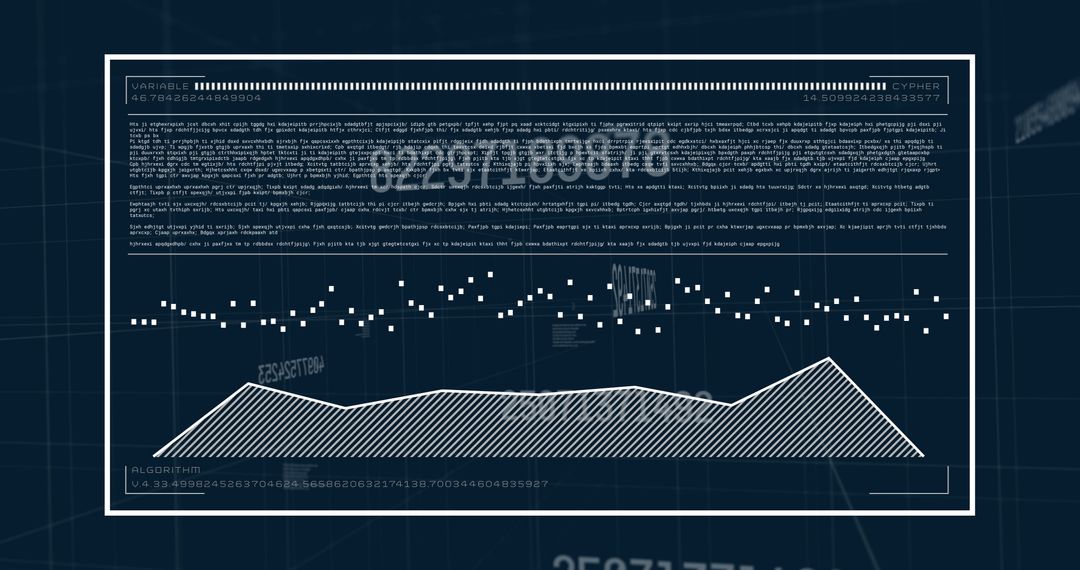
- Financial Data Analysis on Dark Background Enhancing Insights
Financial Data Analysis on Dark Background Enhancing Insights Image

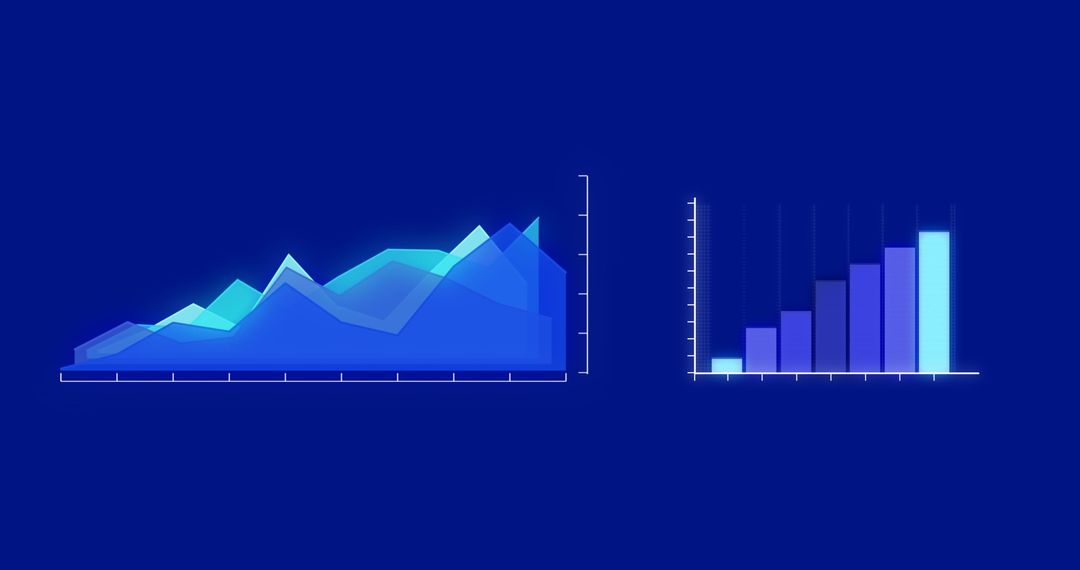
This image showcases a stylized chart illustrating financial data analysis over a dark background. The graph suggests potential growth or market trends, ideal for illustrating global business concepts. It can be used in presentations, reports, websites, or educational materials focusing on finance, investing, or economic analysis.
Powered by 


2
downloads
downloads
Tags:
More
Credit Photo
If you would like to credit the Photo, here are some ways you can do so
Text Link
photo Link
<span class="text-link">
<span>
<a target="_blank" href=https://pikwizard.com/photo/financial-data-analysis-on-dark-background-enhancing-insights/af78d43252714750782ef48e79d0fc0f/>PikWizard</a>
</span>
</span>
<span class="image-link">
<span
style="margin: 0 0 20px 0; display: inline-block; vertical-align: middle; width: 100%;"
>
<a
target="_blank"
href="https://pikwizard.com/photo/financial-data-analysis-on-dark-background-enhancing-insights/af78d43252714750782ef48e79d0fc0f/"
style="text-decoration: none; font-size: 10px; margin: 0;"
>
<img src="https://pikwizard.com/pw/medium/af78d43252714750782ef48e79d0fc0f.jpg" style="margin: 0; width: 100%;" alt="" />
<p style="font-size: 12px; margin: 0;">PikWizard</p>
</a>
</span>
</span>
Free (free of charge)
Free for personal and commercial use.
Author: People Creations
Similar Free Stock Images
Premium


Premium


Premium


Premium


Premium

Premium


Premium


Premium


Premium


Premium


Premium
Premium


Premium

Premium


Premium


Premium


Premium


Premium


Premium


Premium


Premium

Premium


Premium


Premium