- Home >
- Stock Photos >
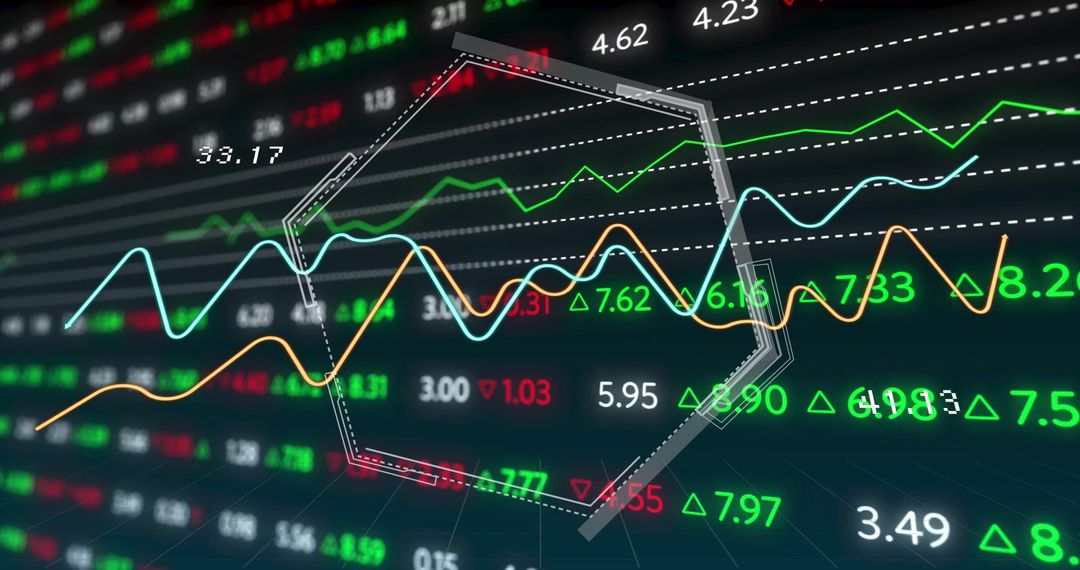
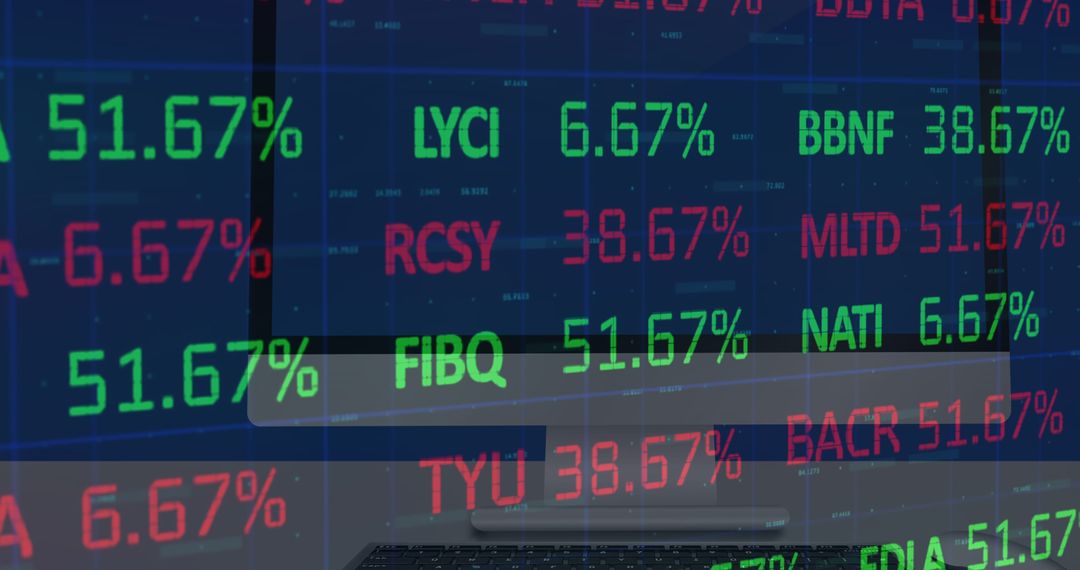
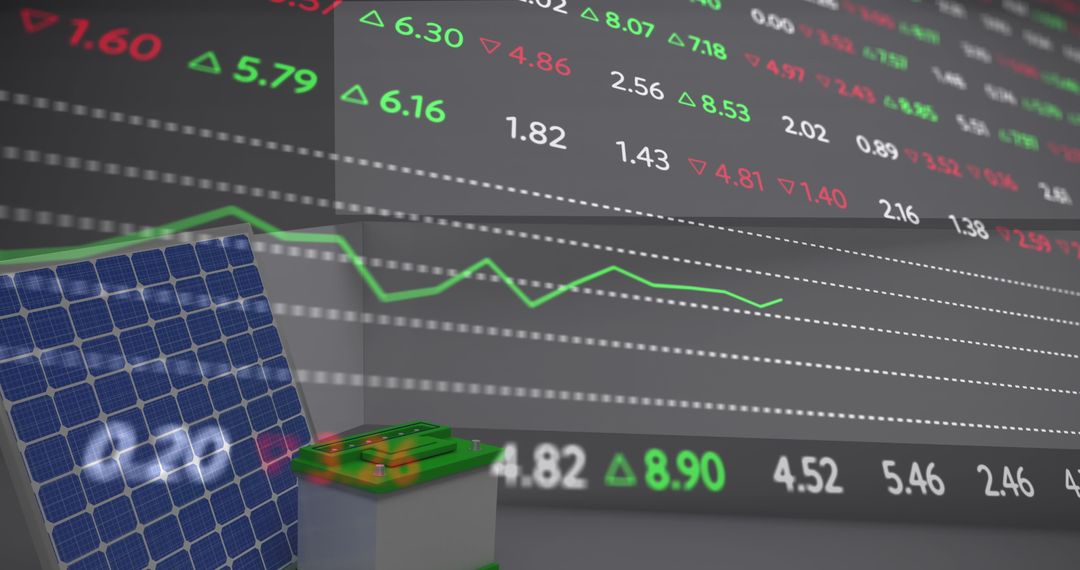
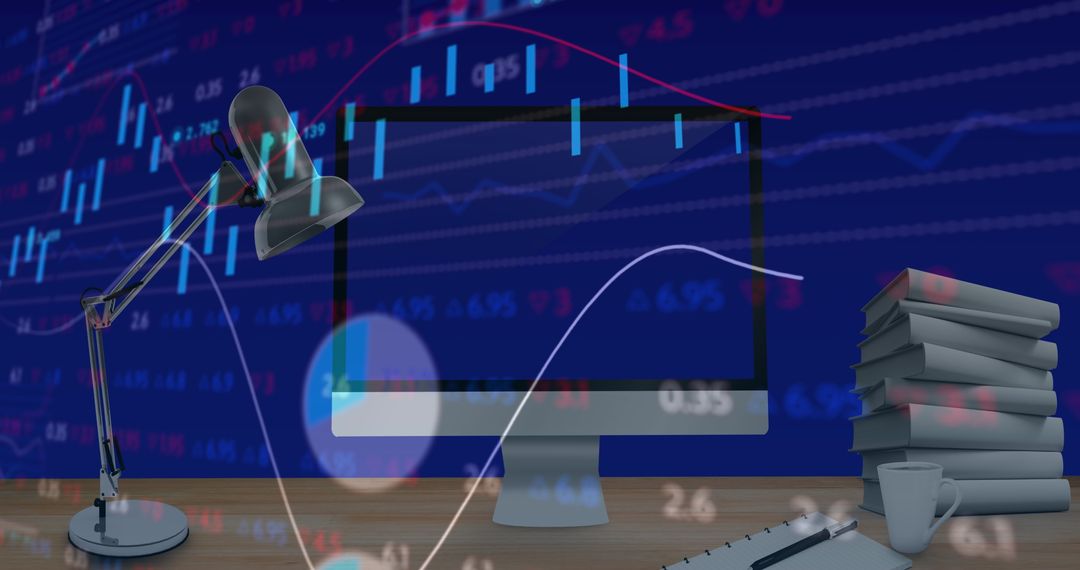
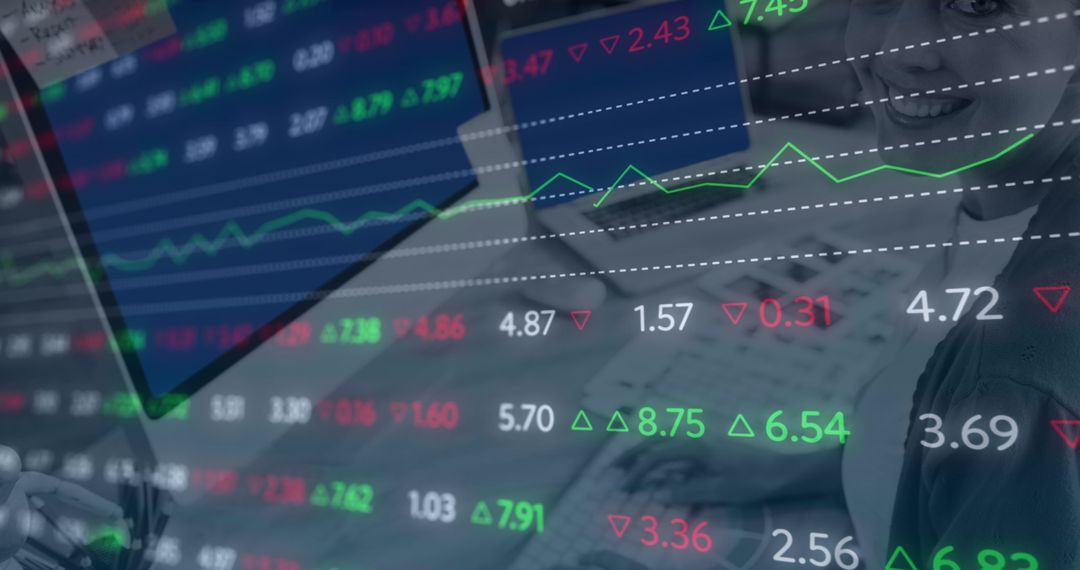
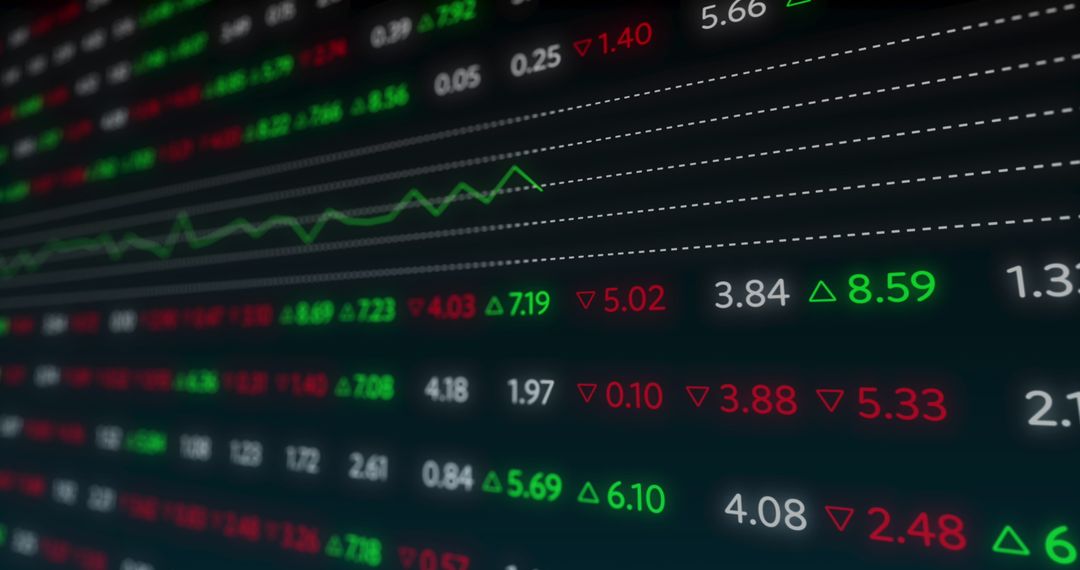
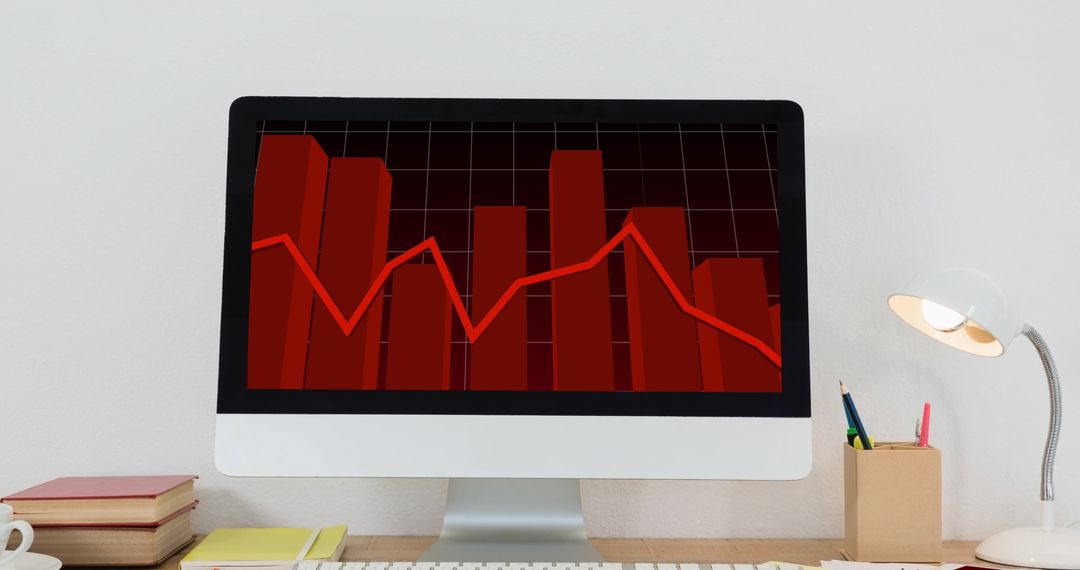
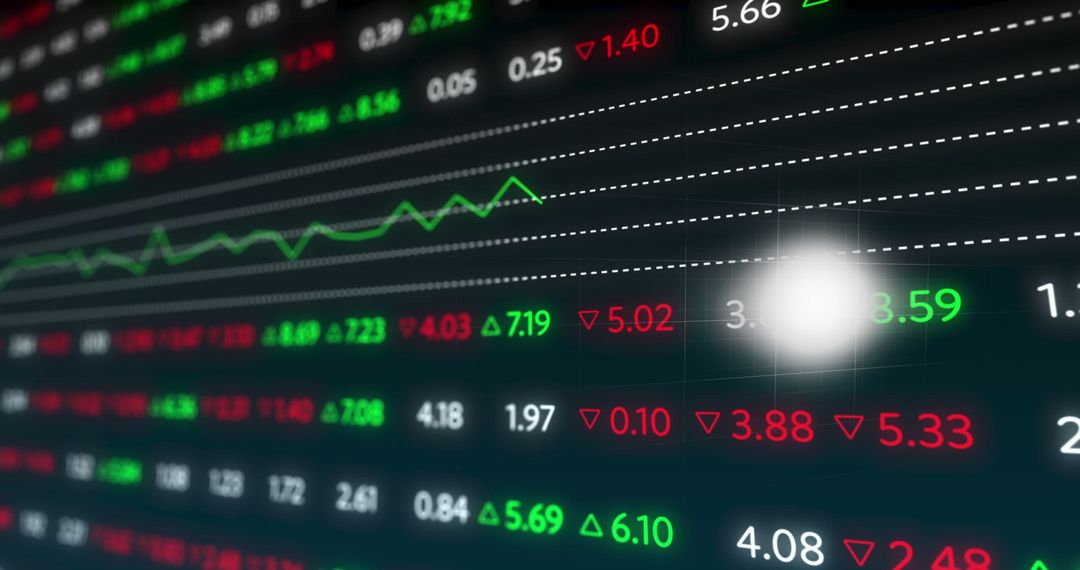
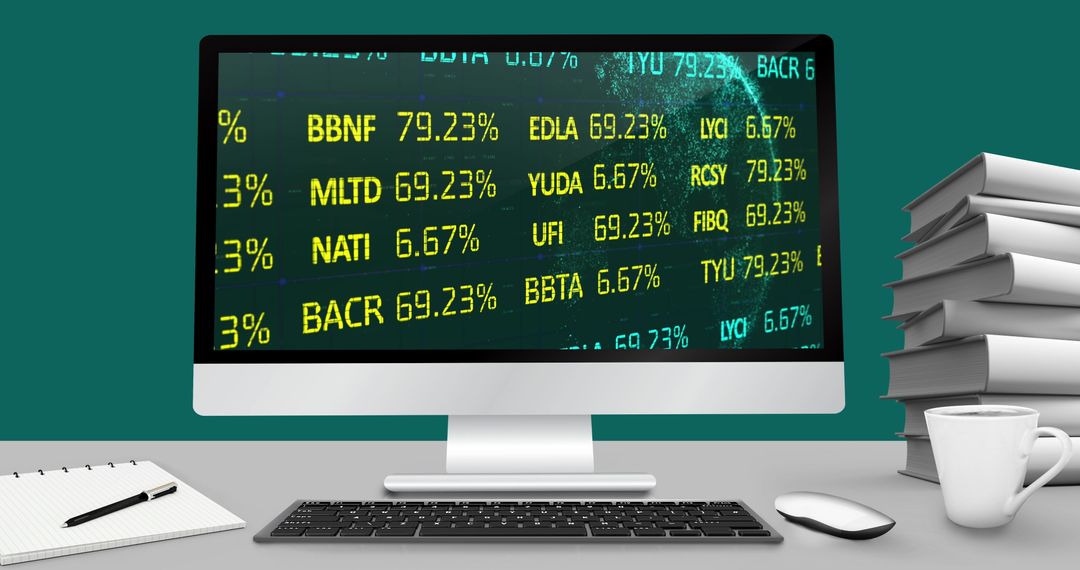
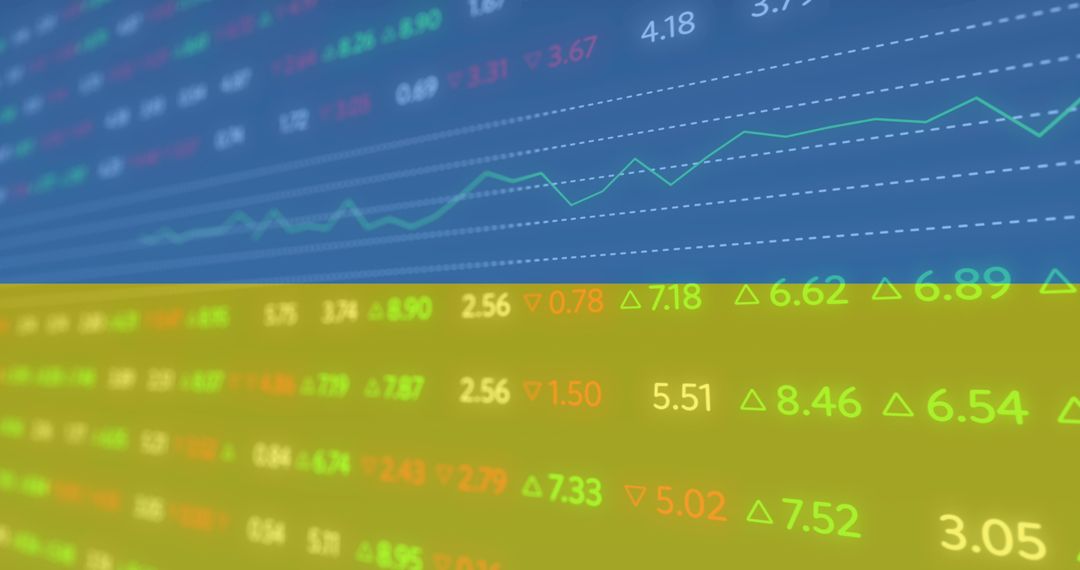
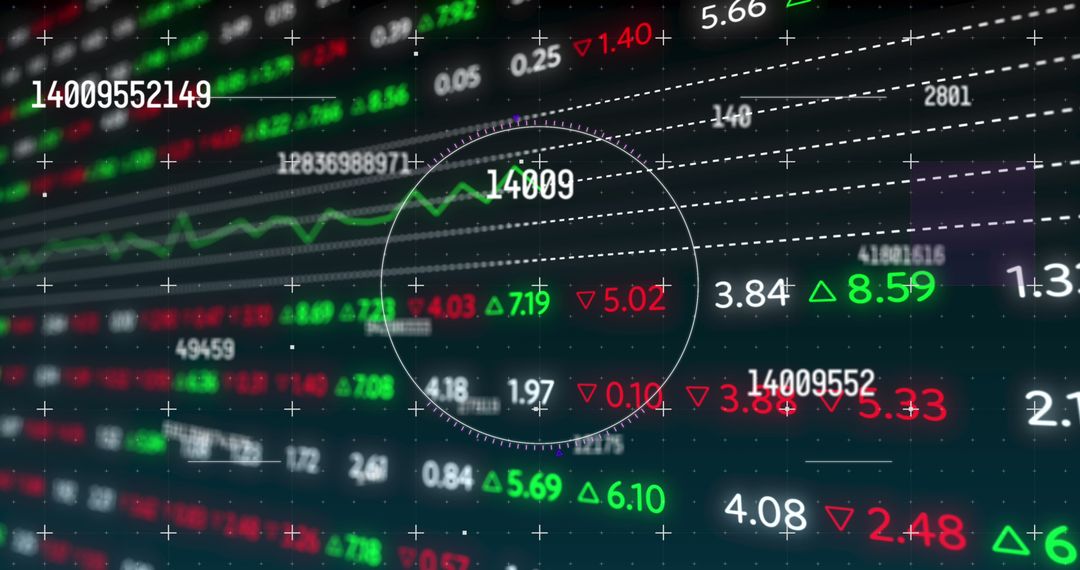
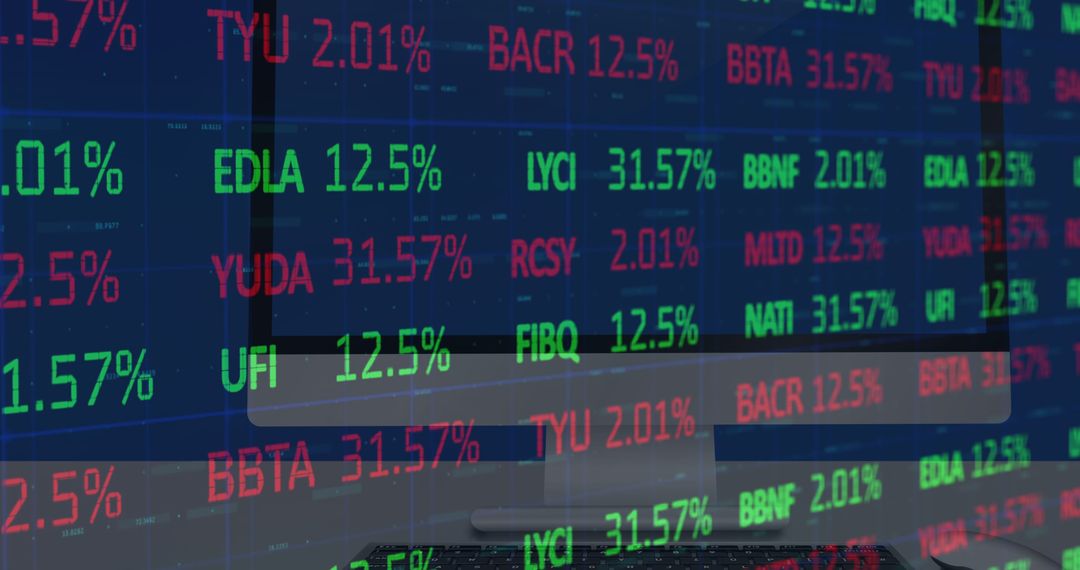
- Financial Data Analysis on Desktop with Trading Stats Background
Financial Data Analysis on Desktop with Trading Stats Background Image

Ideal for articles or presentations on finance, stock market analysis, business technology, and data processing. Perfect visual for blogs discussing market trends, trading strategies, or financial news. Suitable for educational materials on global finance.
Powered by  - Get 15% off with code: PIKWIZARD15


2
downloads
downloads
Tags:
More
Credit Photo
If you would like to credit the Photo, here are some ways you can do so
Text Link
photo Link
<span class="text-link">
<span>
<a target="_blank" href=https://pikwizard.com/photo/financial-data-analysis-on-desktop-with-trading-stats-background/595d01b2ce71f16f40d8546840fc6c39/>PikWizard</a>
</span>
</span>
<span class="image-link">
<span
style="margin: 0 0 20px 0; display: inline-block; vertical-align: middle; width: 100%;"
>
<a
target="_blank"
href="https://pikwizard.com/photo/financial-data-analysis-on-desktop-with-trading-stats-background/595d01b2ce71f16f40d8546840fc6c39/"
style="text-decoration: none; font-size: 10px; margin: 0;"
>
<img src="https://pikwizard.com/pw/medium/595d01b2ce71f16f40d8546840fc6c39.jpg" style="margin: 0; width: 100%;" alt="" />
<p style="font-size: 12px; margin: 0;">PikWizard</p>
</a>
</span>
</span>
Free (free of charge)
Free for personal and commercial use.
Author: Creative Art
Similar Free Stock Images
Premium


Premium


Premium


Premium


Premium


Premium


Premium


Premium


Premium


Premium


Premium


Premium


Premium


Premium


Premium


Premium


Premium


Premium


Premium


Premium


Premium


Premium


Premium


Premium