- Home >
- Stock Photos >
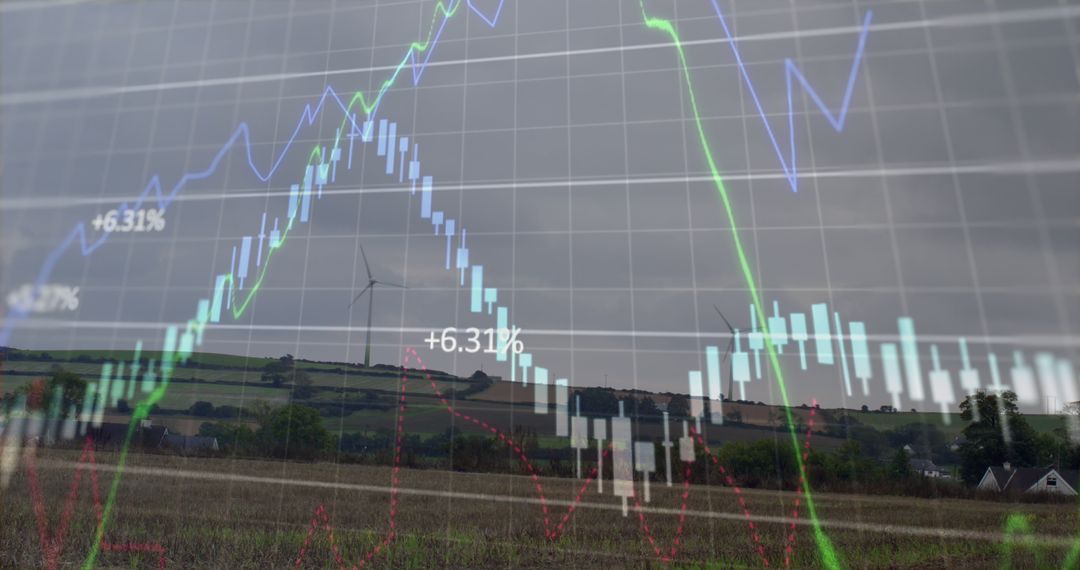
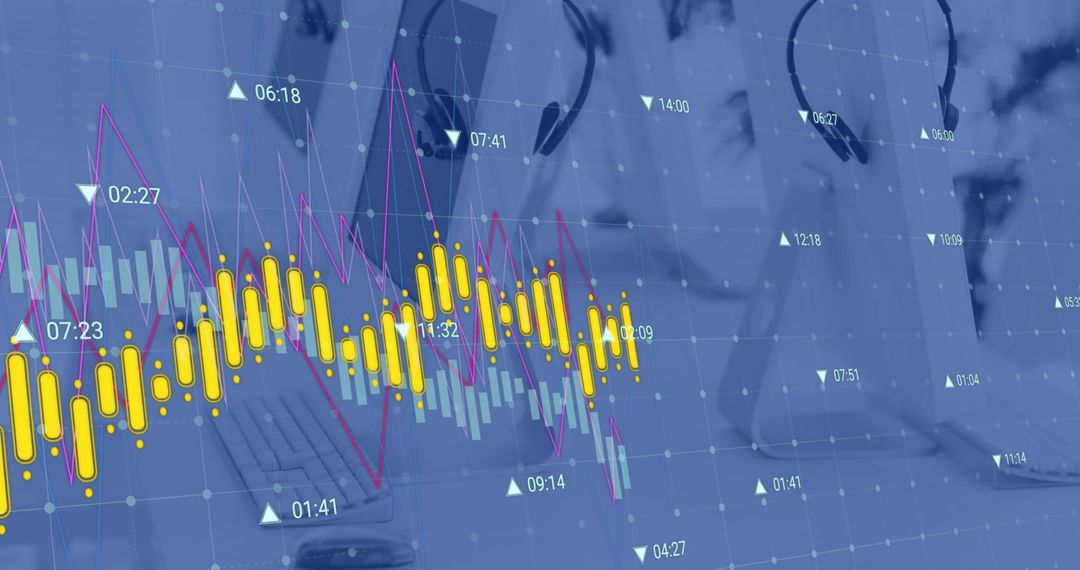
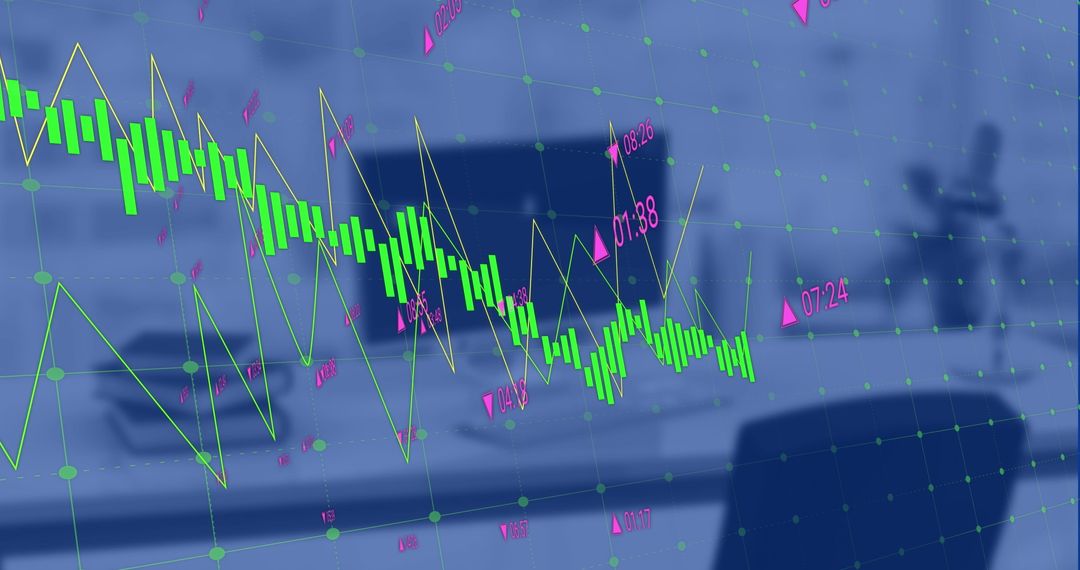
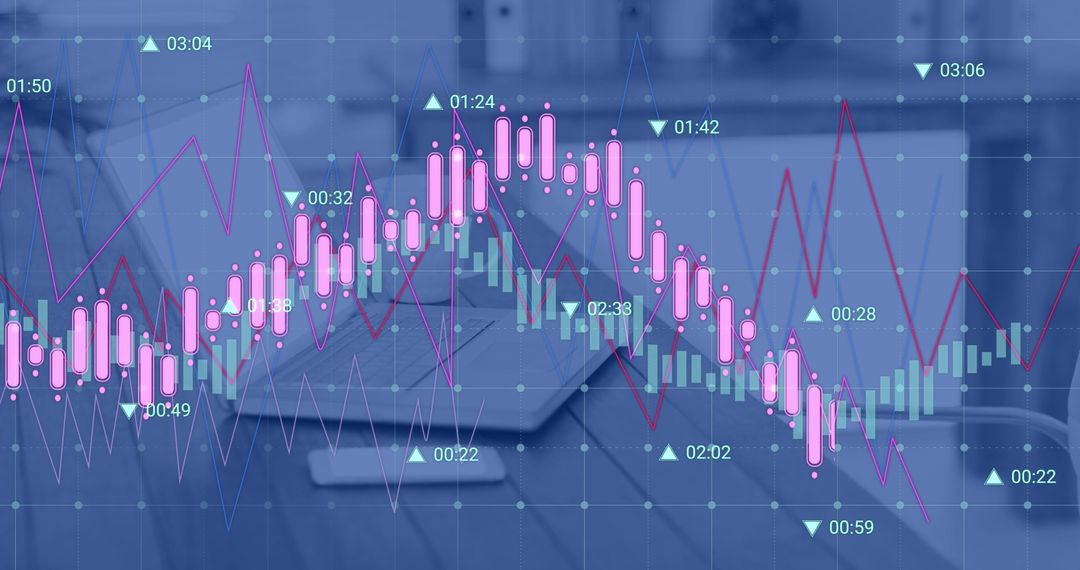
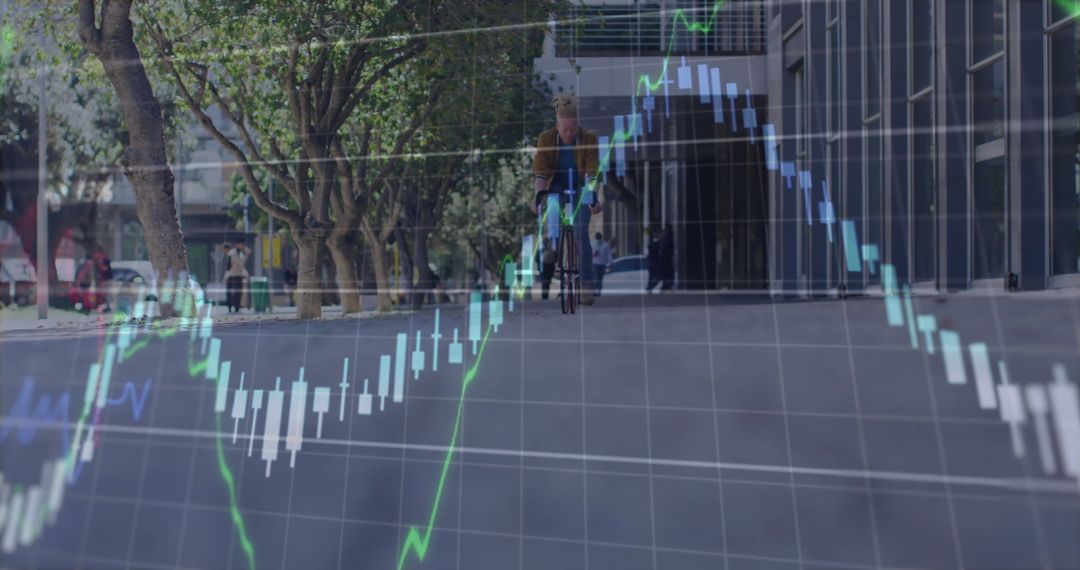
- Financial Data Analysis on Digital Graph Interface with Abstract Office Background
Financial Data Analysis on Digital Graph Interface with Abstract Office Background Image

Abstract depiction of financial data analysis overlaid on digital graph with an out-of-focus office environment. Useful for articles or presentations on finance, data analysis, and business technology. Suitable for illustrating concepts of stock market trends, investment strategies, or financial technology solutions. Ideal for brochures or websites offering financial services or products.
Powered by  - Get 15% off with code: PIKWIZARD15


2
downloads
downloads
Tags:
More
Credit Photo
If you would like to credit the Photo, here are some ways you can do so
Text Link
photo Link
<span class="text-link">
<span>
<a target="_blank" href=https://pikwizard.com/photo/financial-data-analysis-on-digital-graph-interface-with-abstract-office-background/922e4f000d247623add37e4b4ed92da9/>PikWizard</a>
</span>
</span>
<span class="image-link">
<span
style="margin: 0 0 20px 0; display: inline-block; vertical-align: middle; width: 100%;"
>
<a
target="_blank"
href="https://pikwizard.com/photo/financial-data-analysis-on-digital-graph-interface-with-abstract-office-background/922e4f000d247623add37e4b4ed92da9/"
style="text-decoration: none; font-size: 10px; margin: 0;"
>
<img src="https://pikwizard.com/pw/medium/922e4f000d247623add37e4b4ed92da9.jpg" style="margin: 0; width: 100%;" alt="" />
<p style="font-size: 12px; margin: 0;">PikWizard</p>
</a>
</span>
</span>
Free (free of charge)
Free for personal and commercial use.
Author: People Creations
Similar Free Stock Images

Premium


Premium


Premium


Premium


Premium


Premium


Premium


Premium


Premium


Premium


Premium


Premium


Premium


Premium


Premium


Premium


Premium


Premium


Premium


Premium


Premium


Premium


Premium


Premium