
- Home >
- Stock Photos >
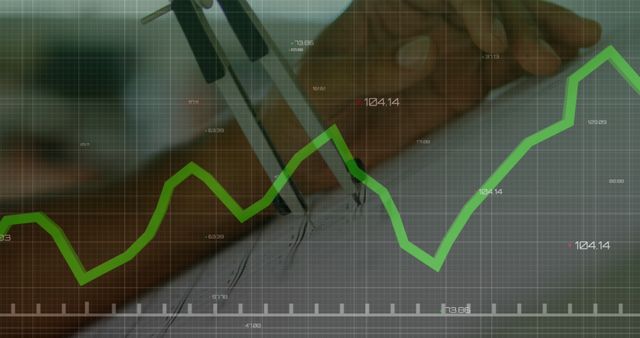
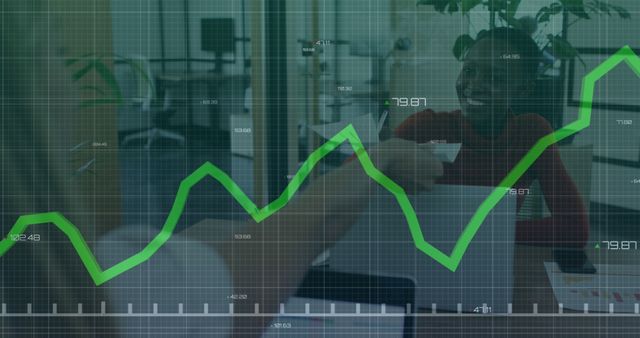
- Financial Data Analysis on Tablet with Digital Graph Overlay
Financial Data Analysis on Tablet with Digital Graph Overlay Image

Image shows hands interacting with a tablet displaying financial graphs and data, symbolizing the intersection of technology and finance. It captures the essence of fintech in a professional setting, great for representing digital transformation, stock market analysis, and modern business operations. Useful for websites and articles on economic trends and technology integration.
Powered by 


downloads
Tags:
More
Credit Photo
If you would like to credit the Photo, here are some ways you can do so
Text Link
photo Link
<span class="text-link">
<span>
<a target="_blank" href=https://pikwizard.com/photo/financial-data-analysis-on-tablet-with-digital-graph-overlay/517c6ee32b4a0965897f2f66e690d8a4/>PikWizard</a>
</span>
</span>
<span class="image-link">
<span
style="margin: 0 0 20px 0; display: inline-block; vertical-align: middle; width: 100%;"
>
<a
target="_blank"
href="https://pikwizard.com/photo/financial-data-analysis-on-tablet-with-digital-graph-overlay/517c6ee32b4a0965897f2f66e690d8a4/"
style="text-decoration: none; font-size: 10px; margin: 0;"
>
<img src="https://pikwizard.com/pw/medium/517c6ee32b4a0965897f2f66e690d8a4.jpg" style="margin: 0; width: 100%;" alt="" />
<p style="font-size: 12px; margin: 0;">PikWizard</p>
</a>
</span>
</span>
Free (free of charge)
Free for personal and commercial use.
Author: Authentic Images
Similar Free Stock Images

Premium


Premium


Premium


Premium


Premium

Premium

Premium


Premium


Premium

Premium


Premium


Premium


Premium

Premium


Premium


Premium


Premium


Premium

Premium

Premium

Premium


Premium

Premium


Premium

Premium


Explore More Free Stock Images