1. Home > 
  2. Stock Photos > 
  3. Financial Data Analysis on Transparent Grid Background

Financial Data Analysis on Transparent Grid Background Image

Financial Data Analysis on Transparent Grid Background

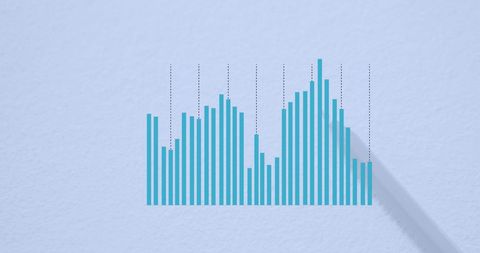
Illustration depicts financial data visualized via transparent blue bar and line graphs over grid. Perfect for presentations or articles on business technology, data processing, and financial strategies. Use to illustrate complex financial trends and data-driven insights.

Powered by Adobe logo
Digital blue stock market analysis graph showing fluctuation and data processing on screen display. - Powered by AdobeAbstract visualization of data with vertical bars and a rising line emanating from a tablet - Powered by AdobeBusinessman's hand touching a glowing virtual bar chart displaying increasing financial data and various business process icons, representing progress and digital transformation - Powered by AdobeHand Touching Interactive Business Data Interface - Powered by AdobeA dynamic representation of financial growth featuring a clear trend graph against an urban skyline. This image symbolizes progress and success in business metrics. Copula - Powered by Adobe

Credit Photo

If you would like to credit the Photo, here are some ways you can do so

Free (free of charge)

Free for personal and commercial use.

Author: People Creations

Similar Free Stock Images

Abstract Financial Data Visualization with Floating Numbers
Premium
Minimal collage. Businesswoman adjusting a tall bar chart positioned between large coin stacks. Concept of corporate strategy, economic correction, challenge management and emotional decision-making.
Financial Data Visualization and Digital Analysis with World Map
Global Data Visualization Over Evening City Skyline
Abstract Financial Data Charts with Glowing Infographic Overlay
Financial Graph Overlay on Cityscape Illustrating Market Trends
Premium
Magnifying glass over blue bar and line graphs highlighting data analysis
Financial Data Processing in High-Tech Environment
Abstract Financial Data with Server Room Overlay and Charts
Abstract Financial Graph and Data Analysis Background
Colorful Data Analytics and Statistics Conceptual Graphics
Premium
Wood cubes showing business benchmarking performance indicators
Financial Data and Graphs on Digital Blue Background
Digital Bar Graph with Blue Data Visualization
Global Financial Data Analysis and Visualization Concept
Financial Growth Graph Over Urban Skyline with Currencies
Premium
Hand completing a project update progress bar with wooden blocks symbolizing task completion goal achievement and reaching 100 percent success in business and project management
Abstract Graphical Data Representation in Blue Tones
Dynamic Visualization of Financial Data and Analysis
Financial Data on Office Desk with Digital Charts
Abstract Financial Data and Charts in Urban City Background
Premium
Woman typing on laptop at office workplace in background. Concept of working process, internet surfing, online business education. Student send e-mail. Close up view. Hands Shot. Stock market chart
Digital Business Graphs with Growth and Analysis Concepts
Digital Financial Data Processing with Blue Background
Financial Growth Bar and Line Graph on Digital Background
Digital Data Chart on Blue Background with Grid Lines
Premium
Hand drawing a colorful bar graph with a pen Generative AI
Abstract Financial Data Analysis on Blue Digital Background
Digital Financial Data Processing Over Grid with Global Map
Financial Data Visualization on Blue Graphical Background
Innovative Business and Finance Graphic Design Concept
Abstract Financial Data with Global Business Interface Concept
Data Analysis Interface with Charts and Statistics on Digital Screen
Premium
AI generated 3D bar chart and line graph with glowing grid background representing stock market trend analysis financial data and modern digital investment concept
Financial Data Analytics in Digital Interface Design
Futuristic Data Visualization Bar Graph Concept
Financial Bar Graph Over Modern Cityscape with Abstract Digital Interface
Financial Bar Graph Overlaying Urban Cityscape Background
Premium
Hand Holding Gold Magnifying Glass Over Glowing Target and Upward Arrow with Wooden Block Bar Graph Showing Successful Business Growth Strategy and Goal Achievement
Financial Data Analysis Overlaying a High-Tech Server Room
Digital Data Analysis Over Blue Background
Visual Data Charts Representing Financial Analytics
Financial Data Trend Analysis with Graphs on Green Background
Premium
Blue bar graph representing business growth and positive progress
Global Business Analytics and Growth Concept Hologram
Creative Light Bulb Maze for Data Processing and Analysis
Abstract Data Analysis Concept with Gradient Background
Digital Bar Graph on Dark Global Business Interface
Premium
Abstract infographic representing data analysis and growth, featuring bar charts, circles, and lines on a textured background, suitable for technology, finance, and business concepts.
Abstract Financial Charts and Data Visualizations
Dynamic Data Graph with Futuristic Technology Background
Global Data Processing with Abstract Graph and Network
Digital Data Processing and Analysis Visualizations
Premium
Business strategy concept with wooden hexagon blocks showing growth chart, idea lightbulb, target, dollar sign, and gear icons symbolizing success and development process
Growing Data Trends on Gradient Background
Financial Data Processing Bar Graph on Minimalist Background
Bar Graph with Grid on Abstract Blue Background
Futuristic Digital Data Analysis Background with Bar Graphs
Premium
Digital display showing vibrant blue, pink, and purple graphs and data visualizations
Abstract Digital Data Processing in Blue Interface
Financial Graph with European Stars Highlight Global Market Trends
Digital Graph Interface Illustrating Financial Data Analysis
Digital Stock Market Pulse with Numbers on Blue Background
Abstract Financial Data Analytics on Blue Background
Digital Analysis Over Bahrain Flag Signifying Energy Data
Premium
Business intelligence strategy with professional using digital tablet to evaluate rising quality, falling cost bar chart, highlighting effective process optimization, value driven financial
Increasing Financial Graph with Urban Cityscape Background
Financial Bar Graph Overlapping Modern City Skyline
Digital Financial Graph Overlaying Cityscape
Digital Financial Data Analysis Over Modern Server Center
Premium
Growth Chart with Bar Graph and Increasing Arrow on Blue Background for Business Success Concept
Digital Data Visualization with Global Interface
Data Analytics Graphs on Blue Digital Background
Colorful Abstract Bar Chart Representing Statistical Data
Abstract Financial Market Analysis with Candlestick and Bar Charts
Premium
3D render marketing dashboard with search analysis conversion and growth charts black background
Financial Analytics with Graphs and Pie Chart on Blue Background
Dynamic Data Visualization with Graphs over Blue Background
Digital Growth Metrics with Dynamic Data Visualization
Digital Finance Data with Icon Overlay on Blue Background
Premium
Ascending arrow and bar graph with upward trend over a circuit board indicating increasing profits, growth, or success
Data Processing Visualization with Digital Charts on Blue Background
Digital Bar and Line Chart with Financial Growth Analysis
Futuristic Data Patterns with Global Connections
Dynamic Financial Data Visualization in Digital Blue
Premium
Data Visualization, Abstract, Colorful, Graphs, Information.
Digital Charts Displaying Data Analytics in Technology Background
Digital Bar Graph with Blue Background Indicating Data Analysis
Digital Interface with Data Processing and Graphs
Futuristic Financial Data and Analytics Visualization
Premium
Stock market chart with financial graph and business data on paper.
Digital Data Analysis Graphs on Blue Background
Encrypted waveform visualizing secure network traffic on futuristic digital dashboard UI
Dynamic Display of Real-Time Data and Digital Analytics
Financial Charts with Upward Trend and Analysis Tools
Data Processing and Analytics Over Cityscape at Night
Digital Financial Analytics with Zero Percent Concept
Premium
Gear resting on a document with bar graphs. Conceptual image for analysis, precision, strategy, and data visualization. Set on a wooden surface with a pen.
Financial Graph Overlay with Cityscape Background
Financial Bar Graph Over Urban Cityscape
Financial Data Analysis Overlaying Server Room
Colorful Bar Graph Representing Financial Data Trends
Premium
Magnifying glass reveals detailed 3D data cubes alongside a growing bar chart, symbolizing analytics and business insight discovery.
Financial Data Graphs Show Income and Tax Trends
Digital Interface with Global Data Processing Concept
Abstract Chart with Multicolor Accents Representing Business Analytics
Digital Holographic Business Growth Charts
Premium
Abstract depiction of digital data flow, waves, and bars in neon colors over dark background
Data Analytics with Stylized Blue Graph Lines Visual
Digital Financial Graphs and Data Visualization on Red Background
Abstract Statistics and Graphs on Purple Background
Statistical Graph Overlay with Pencil on Blue Background
Premium
Abstract digital data visualization with glowing lines and bars representing financial or scientific data
Global Financial Data Analysis with Digital World Map Visualization
Digital Financial Data Charts on Blue Background
Digital Data Overlay on World Map Representing Global Analytics
Visualizing Financial Data Overlaying AI Conceptual Brain
Premium
Bar graphs, charts, and number 2026 with AI and data analysis icons symbolizing future business innovation and analytics Parse
Digital Data Visualization with Graph Over Red Background
Digital Data Graphs Overlaying Urban Background
Financial Data Analysis Graph on Blue Background Concept
Abstract Financial Chart with Statistics on Yellow Background
Premium
Blue and orange graph with a series of cubes that are stacked on top of each other. The graph is meant to represent a progression or growth, with each cube representing a step in the process
Futuristic Blue Analytics Dashboard Displaying Holographic Area and Bar Charts with Global Data Grid