
- Home >
- Stock Photos >
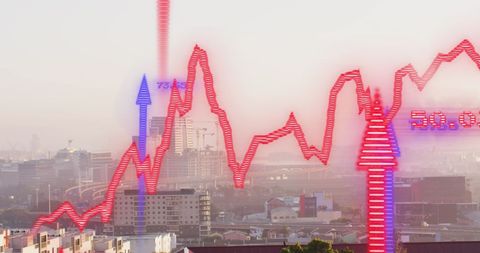
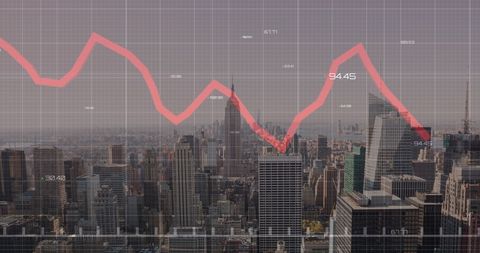
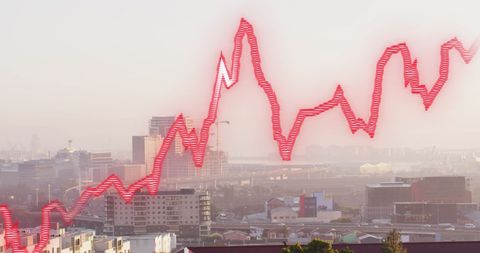
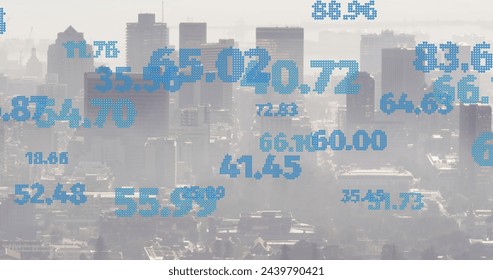
- Financial Data Analysis Over Cityscape Graph
Financial Data Analysis Over Cityscape Graph Image

Imagery of financial data appearing over city hightlighted by towering skyscrapers and illuminated gridlines. Suitable for illustrating concepts related to finance and economics, trend predictions, or use in business presentations highlighting urban markets.
Powered by  - Get 15% off with code: PIKWIZARD15


downloads
Tags:
More
Credit Photo
If you would like to credit the Photo, here are some ways you can do so
Text Link
photo Link
<span class="text-link">
<span>
<a target="_blank" href=https://pikwizard.com/photo/financial-data-analysis-over-cityscape-graph/0cb5ed7f89913100c10f98cf156c89db/>PikWizard</a>
</span>
</span>
<span class="image-link">
<span
style="margin: 0 0 20px 0; display: inline-block; vertical-align: middle; width: 100%;"
>
<a
target="_blank"
href="https://pikwizard.com/photo/financial-data-analysis-over-cityscape-graph/0cb5ed7f89913100c10f98cf156c89db/"
style="text-decoration: none; font-size: 10px; margin: 0;"
>
<img src="https://pikwizard.com/pw/medium/0cb5ed7f89913100c10f98cf156c89db.jpg" style="margin: 0; width: 100%;" alt="" />
<p style="font-size: 12px; margin: 0;">PikWizard</p>
</a>
</span>
</span>
Free (free of charge)
Free for personal and commercial use.
Author: Authentic Images
Similar Free Stock Images

Premium

Premium

Premium


Premium


Premium


Premium

Premium


Premium

Premium


Premium

Premium


Premium


Premium


Premium


Premium


Premium


Premium

Premium


Premium

Premium


Premium


Premium


Premium

Premium


Premium


Explore More Free Stock Images