- Home >
- Stock Photos >
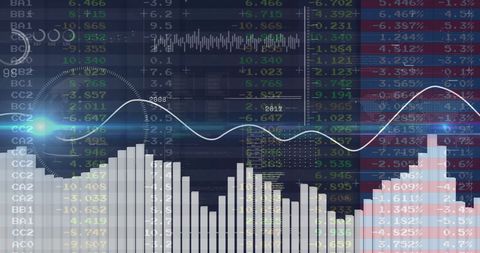
- Financial Data Analysis Overlaid on Digital Background
Financial Data Analysis Overlaid on Digital Background Image

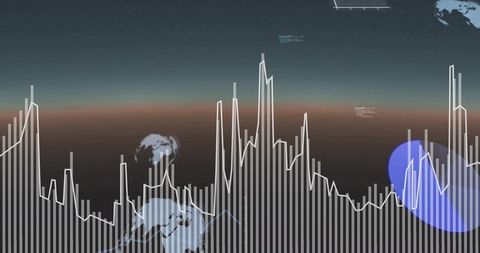
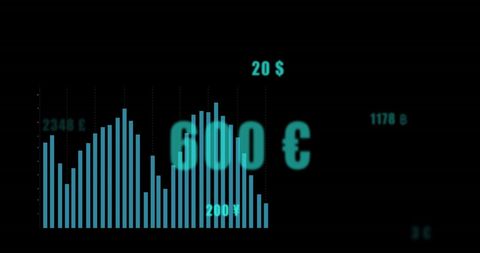
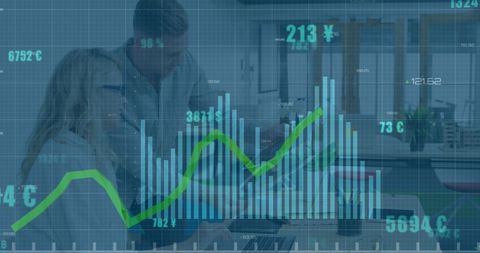
Digital composition shows financial data overlaying a technological background. Bars, graphs, and percentages indicate real-time analysis. Useful for finance, business, or technology themes, emphasizing the intersection of digital innovation and economic trends. Ideal for presentations or websites related to analytics or investing.
Powered by  - Get 15% off with code: PIKWIZARD15


0
downloads
downloads
Tags:
More
Credit Photo
If you would like to credit the Photo, here are some ways you can do so
Text Link
photo Link
<span class="text-link">
<span>
<a target="_blank" href=https://pikwizard.com/photo/financial-data-analysis-overlaid-on-digital-background/7f1835dcb888bcf916438512db508fd5/>PikWizard</a>
</span>
</span>
<span class="image-link">
<span
style="margin: 0 0 20px 0; display: inline-block; vertical-align: middle; width: 100%;"
>
<a
target="_blank"
href="https://pikwizard.com/photo/financial-data-analysis-overlaid-on-digital-background/7f1835dcb888bcf916438512db508fd5/"
style="text-decoration: none; font-size: 10px; margin: 0;"
>
<img src="https://pikwizard.com/pw/medium/7f1835dcb888bcf916438512db508fd5.jpg" style="margin: 0; width: 100%;" alt="" />
<p style="font-size: 12px; margin: 0;">PikWizard</p>
</a>
</span>
</span>
Free (free of charge)
Free for personal and commercial use.
Author: Authentic Images
Similar Free Stock Images
Loading...

Premium


Premium


Premium


Premium


Premium

Premium


Premium


Premium


Premium


Premium


Premium


Premium

Premium


Premium

Premium


Premium


Premium

Premium


Premium

Premium


Premium

Premium


Premium


Premium


Premium