1. Home > 
  2. Stock Photos > 
  3. Financial Data Analysis Overlaid on Warning Sign

Financial Data Analysis Overlaid on Warning Sign Image

Financial Data Analysis Overlaid on Warning Sign

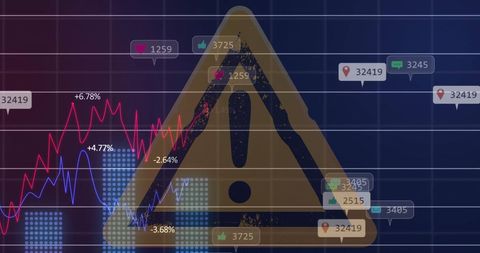
Dynamic depiction of financial data superimposed on a yellow warning triangle symbol. Graphs and metrics illustrate focus on market trends or risk levels. Useful for content focusing on economics, finance warnings, business forecasting, or data visualization discussions.

Powered by Adobe logo
Person touching a glowing red warning sign surrounded by digital interface elements on a dark background - Powered by AdobeCrafting the financial plan for 2025-2026 strategic budget development and forecasting success in future years - Powered by AdobeVisualizing economic downturn hand indicating declining chart financial market trend analysis. - Powered by AdobeHand touching a red warning sign surrounded by data graphs and circular red elements on a dark background - Powered by AdobeRisk management compliance audit checklist with magnifying glass and warning sign concept 100 - Powered by Adobe

Credit Photo

If you would like to credit the Photo, here are some ways you can do so

Free (free of charge)

Free for personal and commercial use.

Author: People Creations

Similar Free Stock Images

Loading...
Dynamic Financial Data Display in Digital Space
Premium
Businessman touching digital warning sign over stock market graph image
Financial Data Overlay on Cityscape Visualizing Market Trends
Premium
A businessman's hand presenting a glowing warning sign, symbolizing caution and risk.
Financial Data Charts with World Map on Blue Digital Background
Fluctuating Financial Graph with Red Line on Green Grid
Rising Digital Graph and Data Visualizations on Black Background
Abstract Triangle Over Financial Data and Graphs
Fluctuating Digital Stock Market Data Chart
Financial Growth Chart Displaying Performance Trends
Statistical Data Processing with Graph Overlay on Buildings
Financial Graph Analysis on Green Grid Background
Premium
Businessperson Presenting Financial Risk and Warning Signs with Rising Graph on a Tablet Device
Premium
Man analyzing financial charts and data with warning signs
Premium
Red arrows with percentage signs showing financial decline and falling prices
Dynamic Business Data and Cityscape Visualization
Digital Data Visualization with Trend Lines and Percentage Changes
Financial Graphs Overlaying Industrial Junkyard
Financial Graphs with Social Media Analytics on Digital Chart
Dynamic Financial Data Visualization on Digital Grid Background
Abstract Financial Data Chart with Positive Trends and Percentages
Digital Graph with Rising and Falling Lines on Grid Background
Dynamic Digital Graph Showing Global Data Movement
Premium
Hand holding smartphone displaying a meme stock chart with a rising trend line and a warning sign on a red screen against a blue background indicating potential investment risk and market volatility
Dynamic Financial Graphs Overlaying Modern Cityscape
Cityscape with Digital Stock Market Graphs and Statistics
Financial Growth Concept with Arrow Sign and Data Charts
Dynamic Financial Data Chart Showing Trend Analysis
Premium
Dramatic arrow pointing down with a break symbolizing financial loss, market crash, or economic downturn in black and white for powerful impact
Digital Data Processing with Chart in Futuristic Interface
Dynamic Data Dashboard with Multicolored Trendlines and Chart Bars
Digital Graphs Displaying Financial Data Analysis in Blue
Dynamic Business Growth Graph with Upward Arrows
Financial Data Analysis with Global Digital Interface
Digital Financial Data Overlaying City Skyline at Dusk
Abstract Digital Data Network with Graphs and Symbols
Financial Data Graph Rendering Global Market Trends
Premium
Magnifying glass with exclamation point over stock market chart on blue background for financial risk and investment analysis concepts
Digital Finance: Modern Stock Market Analysis Display
Digital Financial Dashboard with Graphs and Data Visualization
Futuristic Data Visualization with Graphs and QR Code
Financial Data Statistics Visualized in Urban Setting
Optimized Statistical Data Overlain on Corporate Architecture
Dynamic Data Graphs on Digital Interface Background
Financial Data Overlay on Urban Skyscrapers
Digital Financial Data Graph Showcasing Market Trends
Abstract Digital Finance Chart Showing Fluctuating Graph Lines
Premium
Budget deficit warning sign appears like fiscal cliff in abstract blue digital art showing financial risk and economic uncertainty
Digital Finance Network with User Profiles and Graphs
Financial Growth Graph and Data Analytics Representation
Dynamic Data Visualization with Financial Charts and 3D Elements
Abstract Digital Charts with Social Media Metrics Rising
Premium
Magnifying glass focusing on a red warning sign with checkmarks in the background, symbolizing risk assessment and security vulnerability detection
Futuristic Financial Data Analysis with Rising White Line Graph
Data Analysis Graphics on Digital Grid Background
Digital Data and Financial Charts on White Background
Interactive Social Media Metrics Overlaid on Business Data Graph
Premium
Economic caution visual showing risk alerts and financial volatility. Warning signs highlight economic downturn, market risk, finance crisis, and uncertainty in data-driven analysis. Spline
Dynamic Financial Data Analysis with Growth Indicators
Dynamic Stock Market Chart with Fluctuating Trends and Data Points
Digital Stock Market Graph Red Trendline on Green Background
Interactive Data Visualization with Emerging Analytics Trends
Neon Analytics Dashboard Showing Rising Blue Trend Line, Red Volatility, Dotted Bars
Digital Finance Data Overlaying Futuristic Cityscape
Digital Financial Data and Global Business Analytics
Premium
Risk management alert dashboard with warning sign and decision for system threat, finance, or security analysis. Ideal for business risk assessment, alert interface, and prevention.
World Map with Falling Line Graphs Indicating Global Economic Decline
Premium
Financial fraud detection concept with man holding magnifying glass over digital chart full of red warning signs and analytics on dark background.
Data Recovery Progress Display on Digital Interface
Falling Line Graph on Navy Background Illustrating Economic Decline
Premium
Businessman examining a warning sign and chart through a magnifying glass, isolated on white
Premium
Attention-grabbing warning sign representing early warning systems for loss prevention in financial management concepts
Premium
A man in a suit interacts with a holographic user interface. The focal point is a large, red, triangular warning sign with an exclamation mark. He is pointing a digital pen at the sign, analyzing data
Digital Financial Data with Graph and Grid Patterns
Dynamic Stock Market Graphs and Financial Data
Social Media Activity Icons on Digital Graph
European Market Data Overlay with EU Flag and Financial Graphs
Data Analytics Graphs on Digital Interface Background
Holographic Financial Graph with Dynamic Line Chart
Holographic Charts with Social Media Notifications
Futuristic Data Visualization with Neon Geometric Patterns
Premium
Businessman analyzing stock market chart with magnifying glass and warning sign
Premium
Businessman observes AI warning sign and financial data against a city skyline suit artificial intelligence
Futuristic Keyboard Analytics Display with Digital Graphs and Numbers
Digital Financial Data and AI Illustration Networking Globally
Digital Cityscape with Financial Data Overlay
Financial Data Analysis on Blue Digital Interface
Premium
Proactive risk management concept with hand holding stop loss sign over financial chart
Dynamic Financial Data Overlaid on Grid Background
Abstract Financial Data Processing and Analysis Interface
Dynamic Financial Data Displays Stock Market Trends
Fluctuating Stock Market Graph with Dramatic Peaks
Premium
Downward Trend Graph with Warning Sign Indicator
Premium
Analyzing a Financial Crisis: Magnifying Risk on Stock Charts. A magnifying glass focuses on a red warning sign over a laptop with falling stock trend.
Financial Data Displayed Over City Skyline with Rising Graphs
Financial Data Visualization Over Futuristic Cityscape
Digital Stock Market Trends and Financial Growth Analysis
Financial Data Visualization with Cityscape Overlay
Bitcoin Symbol with Financial Data Dynamic Representation
Financial Data Flow against Urban Skyline Backdrop
Dynamic Line Chart with Histogram on Digital Grid Background
Data Analytics and Financial Growth Indicators
Abstract Financial Data Display with Upward Graph Curves
Innovative Data Analysis with Dynamic Line Graph and Digital Elements
Digital Data Visualization with Blue Grid and Timeline
Premium
Close-up of a laptop displaying a neon exclamation mark and stock graph over wooden table, concept for risk management, financial analysis and cybersecurity vulnerability alerts for financial
Dynamic Financial Charts and Graphs Indicating Market Trends
Dynamic Financial Growth Digital Chart Display
Digital Financial Data Overlay on Urban Street Scene
Rising Graphs and Interactive Financial Data Analytics Background
Digital Stock Market Green Graph Against Dark Trading Board
Premium
Red triangle warning sign symbolizing risk and decline in financial markets with stock chart background illustrating falling trends
Rising Graph Line on Digital Green Grid Background
Rising Financial Data Graph on Digital Grid Background
Dynamic Lines Show Rising Financial Statistics Over Time
Holographic Financial Data Visualization with Stock Trends
Premium
Warning sign on stock market chart indicating financial risk and downturn
Financial Data Analysis Vibrant Graphs on Blue Background
Analyzing Financial Data on Digital World Map Background
Dynamic Financial Graphs Overlaying Urban Skyline
Fluctuating Financial Graph on Green Grid Background
Premium
Businessman pointing at a financial chart with a warning sign, indicating risk in stock market trading and investment, with a smartphone in hand
Financial Growth Stock Nikkei in Urban City Skyline
Digital Visualization of Global Networking with Statistical Graphs
Data Visualization on Analytics Dashboard with Line Graphs and Icons