
- Home >
- Stock Photos >
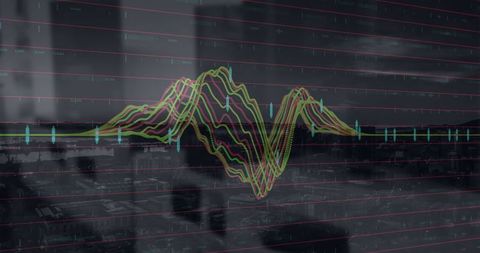
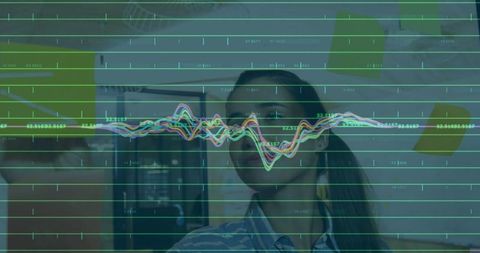
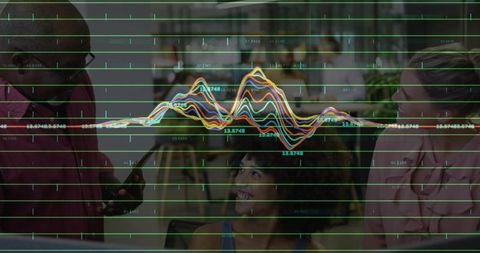
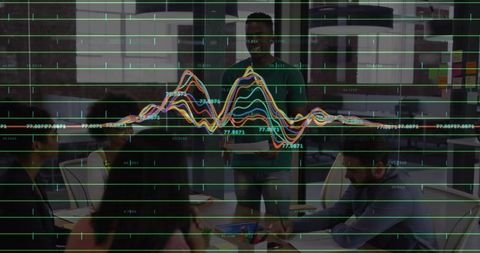
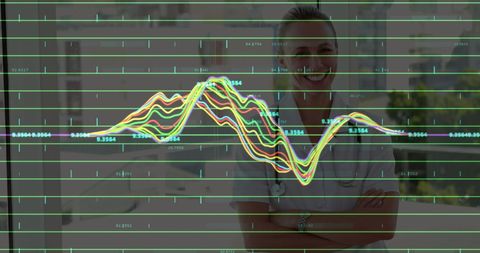
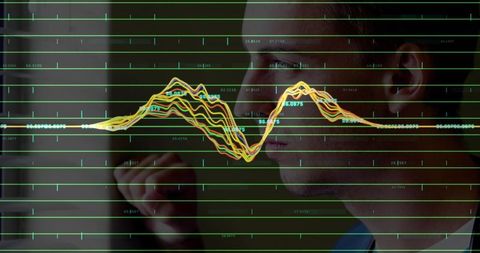
- Financial Data Analysis Overlay on Business Figure
Financial Data Analysis Overlay on Business Figure Image

Dynamic representation of fluctuations in a financial market, this thematic visualization shows a superimposed graph over a business person. Suitable for illustrating articles and presentations focused on market analysis, business analytics, financial forecasting, or economic research.
Powered by 


downloads
Tags:
More
Credit Photo
If you would like to credit the Photo, here are some ways you can do so
Text Link
photo Link
<span class="text-link">
<span>
<a target="_blank" href=https://pikwizard.com/photo/financial-data-analysis-overlay-on-business-figure/fb6a88528683ace88e46891def4c18f5/>PikWizard</a>
</span>
</span>
<span class="image-link">
<span
style="margin: 0 0 20px 0; display: inline-block; vertical-align: middle; width: 100%;"
>
<a
target="_blank"
href="https://pikwizard.com/photo/financial-data-analysis-overlay-on-business-figure/fb6a88528683ace88e46891def4c18f5/"
style="text-decoration: none; font-size: 10px; margin: 0;"
>
<img src="https://pikwizard.com/pw/medium/fb6a88528683ace88e46891def4c18f5.jpg" style="margin: 0; width: 100%;" alt="" />
<p style="font-size: 12px; margin: 0;">PikWizard</p>
</a>
</span>
</span>
Free (free of charge)
Free for personal and commercial use.
Author: People Creations
Similar Free Stock Images
Loading...

Premium


Premium

Premium


Premium


Premium

Premium


Premium


Premium


Premium


Premium


Premium


Premium


Premium

Premium

Premium


Premium


Premium


Premium


Premium


Premium

Premium


Premium


Premium


Premium


Premium


Explore More Free Stock Images