
- Home >
- Stock Photos >
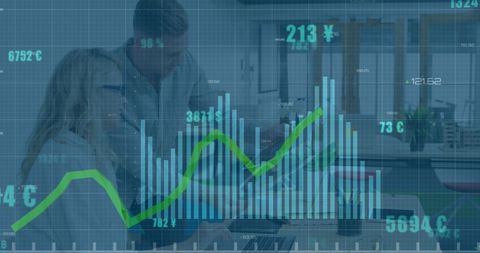
- Financial Data Analysis Overlaying Server Room
Financial Data Analysis Overlaying Server Room Image

This composition combines digital financial data visualizations with an image of a server room, suggesting themes of data processing and digital transformations in global business contexts. Ideal for illustrating articles or presentations about fintech, cloud computing, data security, and modern business technology strategies.
Powered by  - Get 15% off with code: PIKWIZARD15


0
downloads
downloads
Tags:
More
Credit Photo
If you would like to credit the Photo, here are some ways you can do so
Text Link
photo Link
<span class="text-link">
<span>
<a target="_blank" href=https://pikwizard.com/photo/financial-data-analysis-overlaying-server-room/5b37dad749a3606c2c22ddbe3b8e9ad7/>PikWizard</a>
</span>
</span>
<span class="image-link">
<span
style="margin: 0 0 20px 0; display: inline-block; vertical-align: middle; width: 100%;"
>
<a
target="_blank"
href="https://pikwizard.com/photo/financial-data-analysis-overlaying-server-room/5b37dad749a3606c2c22ddbe3b8e9ad7/"
style="text-decoration: none; font-size: 10px; margin: 0;"
>
<img src="https://pikwizard.com/pw/medium/5b37dad749a3606c2c22ddbe3b8e9ad7.jpg" style="margin: 0; width: 100%;" alt="" />
<p style="font-size: 12px; margin: 0;">PikWizard</p>
</a>
</span>
</span>
Free (free of charge)
Free for personal and commercial use.
Author: Awesome Content
Similar Free Stock Images
Loading...

Premium


Premium

Premium

Premium


Premium


Premium

Premium


Premium

Premium


Premium


Premium


Premium


Premium


Premium


Premium


Premium

Premium


Premium

Premium


Premium

Premium


Premium

Premium


Premium


Premium
