1. Home > 
  2. Stock Photos > 
  3. Financial Data Analysis Plus Equity Market Trends

Financial Data Analysis Plus Equity Market Trends Image

Financial Data Analysis Plus Equity Market Trends

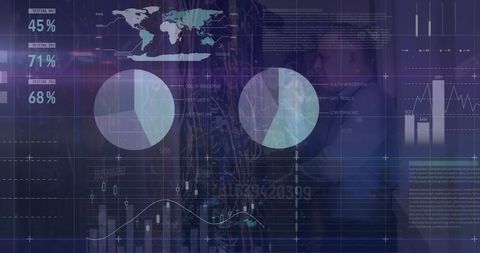
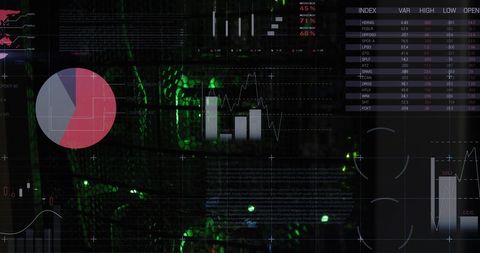
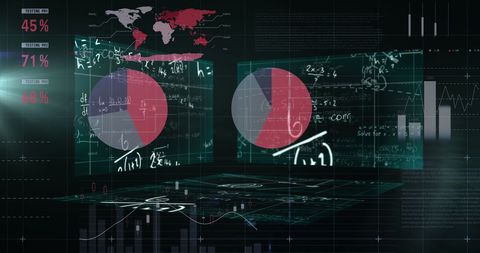
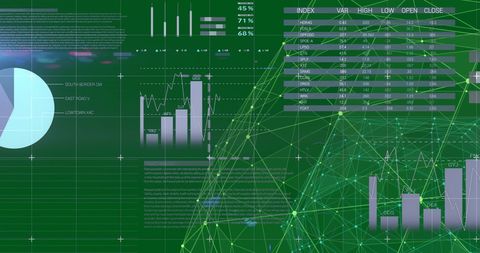
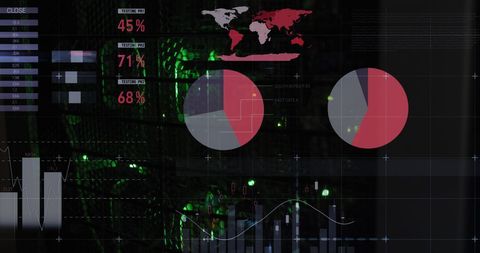
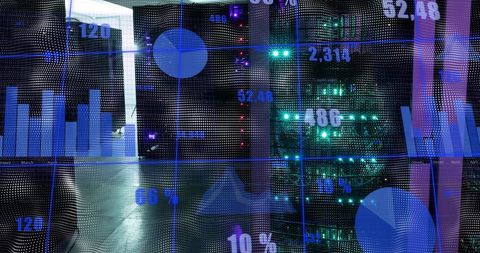
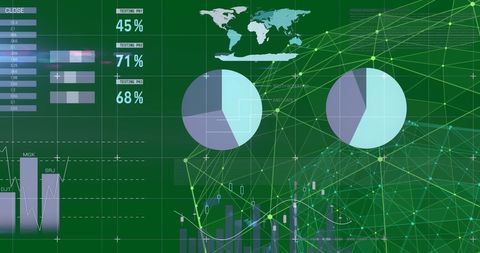
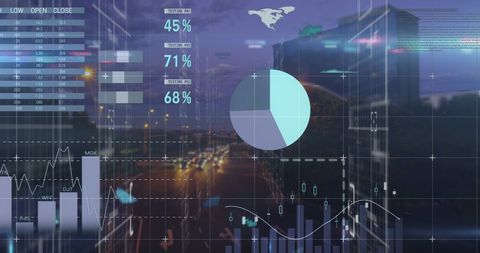
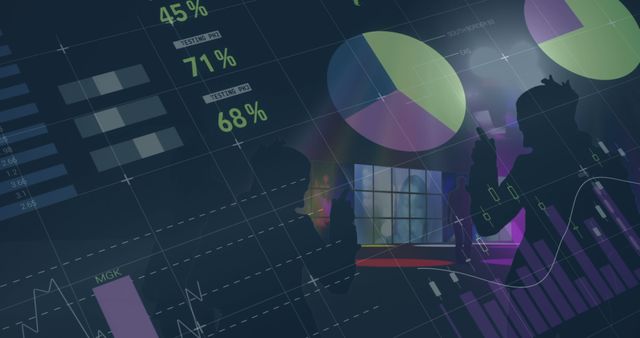
Overlay of financial data processing on an office building, illustrating global business dynamics and digital interface operations. Can be used for presentations on global market trends, financial technology, and investment strategies.

Powered by Adobe logo
Businessman using laptop computer analyzing sales data, financial growth graph chart report. Data analysis with Ai technology. Business planning, strategy and development, Accounting. market research - Powered by AdobeProfessional Latina woman sits at desk in coworking office, focused on her work, looking at computer screen displaying financial charts and stock market data related to trading or financial analysis - Powered by AdobeStock market investment trading graph growth Transparent.Trade business analytics graph and financial chart.PNG chart graph business.	 - Powered by AdobeAn analyst uses a computer and dashboard for data business analysis and Data Management System with KPI and metrics connected to the database for technology finance, operations, sales, marketing - Powered by Adobestock market visual metaphor concept. A crystal ball displaying financial graph trends on a dark cushion. - Powered by Adobe

Credit Photo

If you would like to credit the Photo, here are some ways you can do so

Free (free of charge)

Free for personal and commercial use.

Author: Creative Art

Similar Free Stock Images

Loading...
Abstract Math and Science Data Visualization
Premium
US Capitol building with American flag and financial stock market charts. Economy and business concept. Investment and finance in America.
Abstract Financial Graphs in Modern Office Environment
Premium
Data analyzing and stock market visualization with digital charts, financial dashboards, and performance metrics. Ideal for investment analysis, trading strategy, and economic forecasting.
Premium
Golden key unlocking a digital stock market chart technology access
Digital Security Concept with Circuit Padlock
Abstract Digital Data Streams and Cyber Patterns
Futuristic Digital Data Interface Over Urban Landscape
Financial Technology and Digital Data Integration
Premium
African American businessman analyzing financial data and market trends on digital tablet screen, close up view of hands touching interactive charts.
Data and Analytics Overlay on Bustling Cityscape
Abstract Financial Data Overlaid on Dancing Crowd Background
Data Visualization Over Cityscape
Financial Data Analytics Conceptual Overlaid with Cityscape
Premium
Drive your business growth like a pro with data-driven insights for financial success and prosperity
Digital Data Processing and Financial Chart Analysis
High-Tech Data Analysis Interface with Graphs and Viewfinder
Futuristic Global Report with Holographic Digital Interface
Digital Data Interface with Statistical Analysis and Charts
Business Analytics with Diverse Professionals Concept
Digital Interface Overlaying Cityscape with Data Visualization
Futuristic Data Analytics with Digital Graphs in Modern Office
Futuristic Data Processing Room with Holographic Interface
Premium
Businessman analyzing real estate investment data with futuristic city skyline and candlestick chart, property growth, market trends, and financial analytics.
Digital Financial Data Analytics Over Urban Background
Global Data Analytics with Financial Graphs Overlay
Financial Data Analysis Overlaying Cityscape for Business Insights
Financial Data Processing Over Cityscape with Global Connections
Global Digital Network Concept with Cyber Security Elements
Futuristic Digital Dashboard with Data Visualizations and Globe
Futuristic Holographic Data Dashboard Displaying Global Analytics, Charts and Code UI
Futuristic Digital Data Matrix with Statistical Graphics
Futuristic Data Analysis Digital Interface with Graphs and Equations
Equations and Statistical Data Moving on Digital Interface
Futuristic Data and Statistics Interface in Modern Server Room
Dynamic Financial Data Visualization Over Black Background
Digital Financial Data Display with Global Interface
Premium
A focused individual analyzes digital financial data on a futuristic interface, highlighting trends and insights with a finger gesture.
Premium
Abstract glowing financial chart with candlestick graph and currency exchange data on dark background representing stock market analysis and trade. 3D Rendering
Premium
Hand pointing at a world map with stock market charts and data overlays indicating global financial activity
Business Analytics Technology Over Cityscape Conceptual
Digital Analytics Dashboard Interface Over City
Global Data Processing with Digital Interface Concepts
Futuristic Interface Displaying Global Economic Data
Premium
Analyzing financial data on a smartphone, with charts and graphs in the background
Digital Interface with Graphs and Network Connections for Data Processing
Abstract Financial Data with Business Background
City Overlaid with Financial Charts and Global Data Visuals
Premium
Achieve business success with strategic targets and build a strong foundation for growth with data analysis and a clear focus on goals
Futuristic Holographic Infographic with Financial Icons
Digital Interface with Data Visualization in Abstract Background
Global Financial Analytics with Interactive Data Visualization
Global Data Analysis Interface with Rotating Digital Globe
Premium
Business financial chart with moving up arrow graph.Financial data charts with glowing stock market graphs.Stock market investment data and analysis finance graph.
Data and Statistics Processing on Digital Screens
Futuristic Digital Interface with Data Flow and Analytics
Futuristic Interface Displaying Global Data Analytics Processing
Abstract Global Data Analytics Interface with Cityscape Background
Data Processing Overlay on IT Engineer with Technology Interface
Financial Data Analysis in Futuristic Digital Display
Futuristic Digital Stock Trading Interface with Analytics
Visualizing Futuristic Data Dashboard Showing Interactive Analytics and Financial Trends
Premium
Stethoscope health, medical research, financial growth. Healthcare industry success, rise in medical business, improvement in treatment, modern medicine, medical technology, research. Healthcare cost
Futuristic Data Visualization with Graphs and Analytics Interface
Futuristic Digital Data Interfaces with Mathematical Equations
Premium
Financial market analysis with stock graph overlay and industrial skyline at dusk
Digital Interface and Data Processing in Modern Server Room
Futuristic Digital Data Interface on Screen
Global Data Analytics and Cloud Computing Concept
Futuristic Digital Interface with Data Streams and Network Connections
Digital Statistics Interface with Mathematical Equations
Digital Financial Data and Technology Visualization
Abstract Data Visualization with City Skyline
Abstract Digital Interface with Data Visualizations over Cityscape
Cryptographic Security Interface with Digital Networks
Futuristic Financial Chart Overlay with Cityscape Background
Financial Data Analytics Over Cityscape with Digital Graphics
Data Security Interface in Modern Server Room Environment
Data Analysis Overlapping Tech Graphics on Server Lights
Premium
Sales data analysis dashboard showing performance, trends, and insights. Sales data tracks growth, supports decisions, sales data boosts strategy, and sales data drives performance.
Data Analysis and Finance Concept with Graphs and Maps
Premium
Financial data displayed on a screen
Premium
Analyze vibrant data trends with a laptop for strategic business decisions and gain insightful analytics for success in today's competitive market
Futuristic Financial Infographics with Virtual Globe and Graphs
Dynamic Statistical Data Projection and Mathematical Equations
Global Financial Data Analysis with Interactive Charts
Digital Screens Displaying Statistical Charts and Mathematical Equations
Premium
Night cityscape backdrop with dynamic stock market graph overlaid
Digital Analytics Interface Overlaying Cityscape for Financial Marketing
Digital Interface with Technological Data Over Gloomy Cityscape
Futuristic Digital Data Interface in Server Room
Futuristic Data Visualization Overlay on Urban Nighttime Highway
Premium
Tractor harvesting wheat in field with financial graphs overlay illustrating agricultural economics
Neon Teal HUD Dashboard Showing Green Semi-Transparent Pie Charts, World Map Analytics
Mathematical Equations with Digital Statistical Analysis
Mathematical Equations on Digital Interface with Statistical Data
Abstract Visual: Data Analytics and Graph Processing Concept
Digital Data Visualization with Server Technology Background
Global Financial Data Analytics with Digital Interface
Digital Ruble Symbol Overlay on Data Visualization Interface
Cyber Attack Warning on Global Digital Network
Global Financial Analysis with Digital Interface Elements
Digital Interface and Data Analytics Over Cityscape
Digital Face Merging with Data Streams in Virtual Space
Digital World Map and Data Overlay in Server Room
Premium
Large screen display showing various business graphs and charts.
Premium
low-angle view of a corporate skyscraper is overlaid with blue and white stock market graphs and trading charts, representing financial technology and economic data.
Financial Analytics Over Cityscape with Data Visualization
Cybersecurity Alert with Digital Data Interface
Financial Data and Business People in Motion
Digital Interface with Timelapse Exuding Financial Data Complexity
Futuristic Data Display Over Cityscape with Digital Interface
Cyber Security Concept with Growth Hacking Data Overlay
Data Processing Technology in Modern Office Environment
Digital Globe with Data and Mathematics Background
Premium
A robotic hand interacting with a glowing holographic bar chart emerging from a digital tablet, symbolizing AI-driven data analysis, business intelligence, and futuristic technology.
Futuristic Data Center Dashboard Display with Graphs and Charts Inc.
Abstract Data Visualization with Mathematical Equations
Abstract Digital Data Exchange Over Server Unit Background
Global Financial Data Processing Interface with Analytics
Premium
A businesswoman analyzes financial documents with charts and graphs at a desk, highlighting data trends with a pen in a bright, professional office setting.
Premium
Business data dashboard provide business intelligence analytic for marketing strategy planning brisk with big data set to analyze customer demands and foreseeing business future
Premium
Tax finance budget, Financial accounting. Businessman analyzing financial report, holding pen and smartphone, reviewing. Payment, Debt, Penalty, Credit Bill, Businessman, Money Office
Futuristic Analytics Dashboard Interface with Charts
Maroon Data Dashboard Showing Declining Red Area Chart With Pie Charts and Candlestick Trends
Explore More Free Stock Images