
- Home >
- Stock Photos >
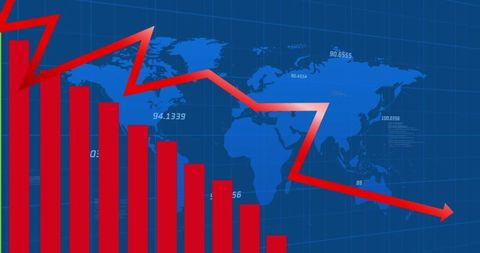
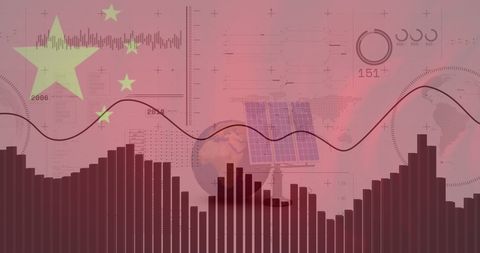
- Financial Data Analysis Superimposed on Global Map Background
Financial Data Analysis Superimposed on Global Map Background Image

Abstract representation of financial information displayed with bar charts and line graphs in front of a subtle world map background, suitable for visualizing global economic trends, finance sector use, and business analytics presentations.
Powered by 


downloads
Tags:
More
Credit Photo
If you would like to credit the Photo, here are some ways you can do so
Text Link
photo Link
<span class="text-link">
<span>
<a target="_blank" href=https://pikwizard.com/photo/financial-data-analysis-superimposed-on-global-map-background/4d0c178b86197a11b33a014f7ef4737e/>PikWizard</a>
</span>
</span>
<span class="image-link">
<span
style="margin: 0 0 20px 0; display: inline-block; vertical-align: middle; width: 100%;"
>
<a
target="_blank"
href="https://pikwizard.com/photo/financial-data-analysis-superimposed-on-global-map-background/4d0c178b86197a11b33a014f7ef4737e/"
style="text-decoration: none; font-size: 10px; margin: 0;"
>
<img src="https://pikwizard.com/pw/medium/4d0c178b86197a11b33a014f7ef4737e.jpg" style="margin: 0; width: 100%;" alt="" />
<p style="font-size: 12px; margin: 0;">PikWizard</p>
</a>
</span>
</span>
Free (free of charge)
Free for personal and commercial use.
Author: Authentic Images
Similar Free Stock Images

Premium


Premium

Premium


Premium

Premium


Premium


Premium


Premium


Premium

Premium


Premium


Premium


Premium


Premium


Premium


Premium

Premium


Premium


Premium

Premium


Premium


Premium


Premium

Premium


Premium


Explore More Free Stock Images