
- Home >
- Stock Photos >
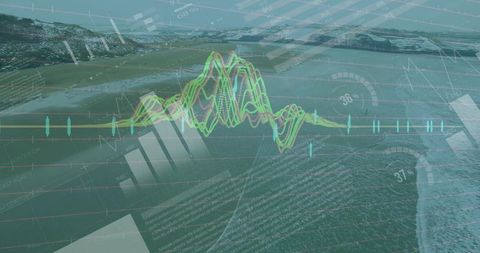
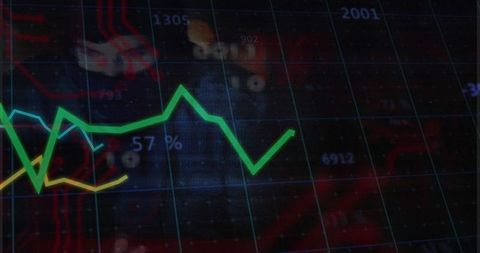
- Financial Data Analysis with Abstract Digital Graphs and PC
Financial Data Analysis with Abstract Digital Graphs and PC Image

Concept of financial data processing involving modern technology and digital dashboards. Visual overlay of graphs and data reflecting analytical trends on display. Suitable for use in business presentations, financial service advertisements, or articles on tech advancements in finance.
Powered by 


downloads
Tags:
More
Credit Photo
If you would like to credit the Photo, here are some ways you can do so
Text Link
photo Link
<span class="text-link">
<span>
<a target="_blank" href=https://pikwizard.com/photo/financial-data-analysis-with-abstract-digital-graphs-and-pc/c19b76d501973fe61bbf7fb26c2b9c8c/>PikWizard</a>
</span>
</span>
<span class="image-link">
<span
style="margin: 0 0 20px 0; display: inline-block; vertical-align: middle; width: 100%;"
>
<a
target="_blank"
href="https://pikwizard.com/photo/financial-data-analysis-with-abstract-digital-graphs-and-pc/c19b76d501973fe61bbf7fb26c2b9c8c/"
style="text-decoration: none; font-size: 10px; margin: 0;"
>
<img src="https://pikwizard.com/pw/medium/c19b76d501973fe61bbf7fb26c2b9c8c.jpg" style="margin: 0; width: 100%;" alt="" />
<p style="font-size: 12px; margin: 0;">PikWizard</p>
</a>
</span>
</span>
Free (free of charge)
Free for personal and commercial use.
Author: People Creations
Similar Free Stock Images

Premium


Premium

Premium

Premium


Premium


Premium

Premium


Premium


Premium


Premium


Premium


Premium


Premium


Premium

Premium

Premium


Premium


Premium

Premium


Premium


Premium


Premium


Premium


Premium

Premium

Explore More Free Stock Images