
- Home >
- Stock Photos >
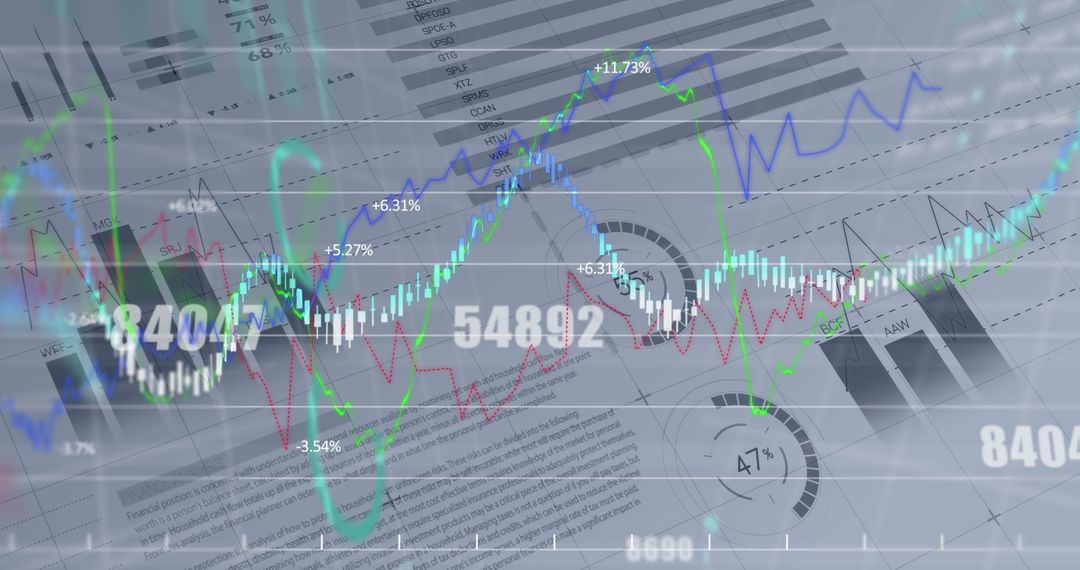
- Financial Data Analysis with Abstract Digital Overlay
Financial Data Analysis with Abstract Digital Overlay Image

Abstract depiction of financial data with digital overlay combines visuals of stocks, graphs, and numerical analysis on an orange-themed background. Useful for illustrating finance concepts, presentations, or as a business analyst's visual aid to convey growth, market trends, or economic forecasts.
Powered by  - Get 15% off with code: PIKWIZARD15


2
downloads
downloads
Tags:
More
Credit Photo
If you would like to credit the Photo, here are some ways you can do so
Text Link
photo Link
<span class="text-link">
<span>
<a target="_blank" href=https://pikwizard.com/photo/financial-data-analysis-with-abstract-digital-overlay/3c9af9985446a0308757cc57cddf6968/>PikWizard</a>
</span>
</span>
<span class="image-link">
<span
style="margin: 0 0 20px 0; display: inline-block; vertical-align: middle; width: 100%;"
>
<a
target="_blank"
href="https://pikwizard.com/photo/financial-data-analysis-with-abstract-digital-overlay/3c9af9985446a0308757cc57cddf6968/"
style="text-decoration: none; font-size: 10px; margin: 0;"
>
<img src="https://pikwizard.com/pw/medium/3c9af9985446a0308757cc57cddf6968.jpg" style="margin: 0; width: 100%;" alt="" />
<p style="font-size: 12px; margin: 0;">PikWizard</p>
</a>
</span>
</span>
Free (free of charge)
Free for personal and commercial use.
Author: People Creations
Similar Free Stock Images

Premium


Premium


Premium


Premium


Premium


Premium


Premium


Premium


Premium


Premium


Premium


Premium


Premium


Premium


Premium


Premium


Premium


Premium


Premium


Premium


Premium


Premium


Premium


Premium

