- Home >
- Stock Photos >
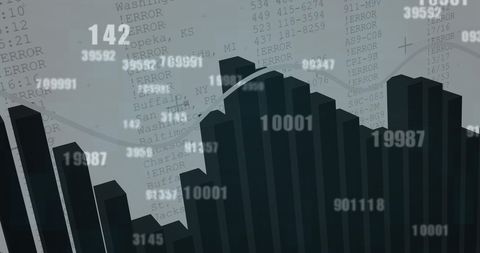
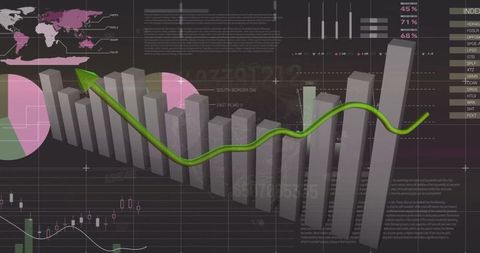
- Financial Data Analysis with Bar Chart
Financial Data Analysis with Bar Chart Image

Illustrates comprehensive analysis in financial data processing with a prominent bar chart overlaid on a dark background. Ideal for use in business presentations, financial reports, data analysis articles, and educational materials focusing on the global business landscape and trends.

downloads
Tags:
More
Credit Photo
If you would like to credit the Photo, here are some ways you can do so
Text Link
photo Link
<span class="text-link">
<span>
<a target="_blank" href=https://pikwizard.com/photo/financial-data-analysis-with-bar-chart/f2b1298fa863dc78202386cb328d9c59/>PikWizard</a>
</span>
</span>
<span class="image-link">
<span
style="margin: 0 0 20px 0; display: inline-block; vertical-align: middle; width: 100%;"
>
<a
target="_blank"
href="https://pikwizard.com/photo/financial-data-analysis-with-bar-chart/f2b1298fa863dc78202386cb328d9c59/"
style="text-decoration: none; font-size: 10px; margin: 0;"
>
<img src="https://pikwizard.com/pw/medium/f2b1298fa863dc78202386cb328d9c59.jpg" style="margin: 0; width: 100%;" alt="" />
<p style="font-size: 12px; margin: 0;">PikWizard</p>
</a>
</span>
</span>
Free (free of charge)
Free for personal and commercial use.
Author: People Creations