- Home >
- Stock Photos >
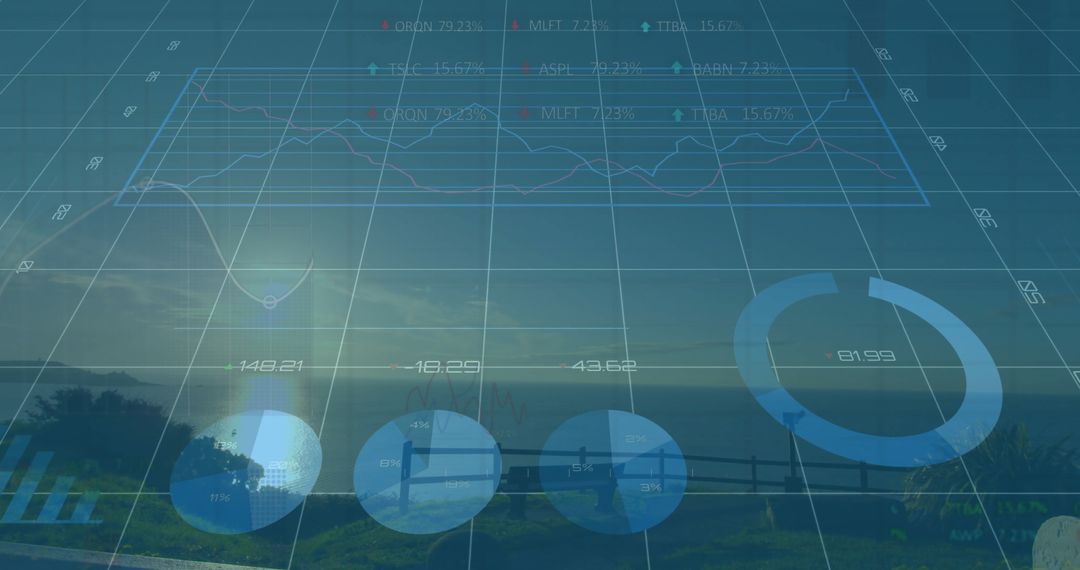
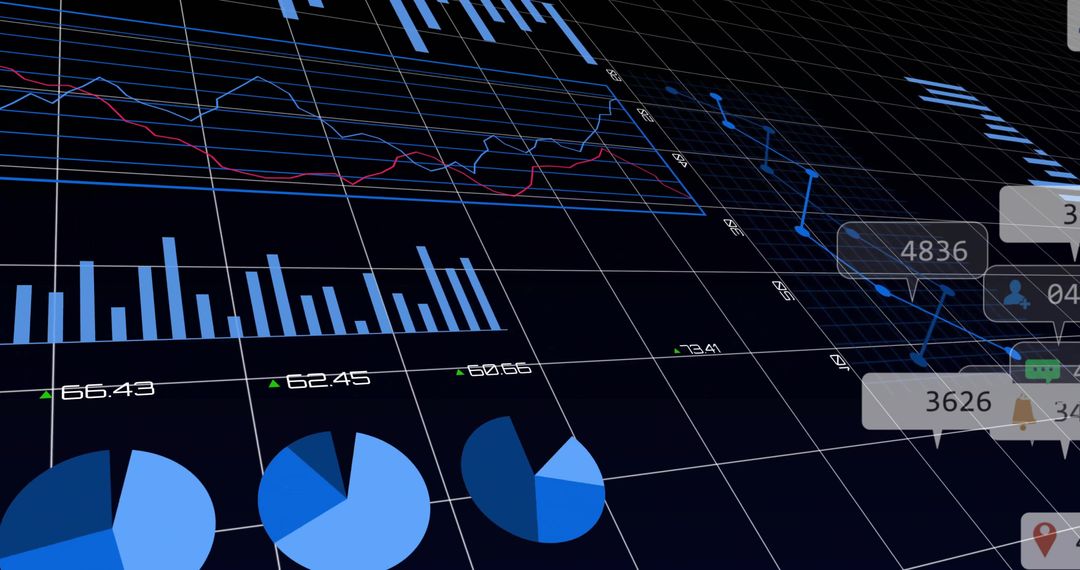
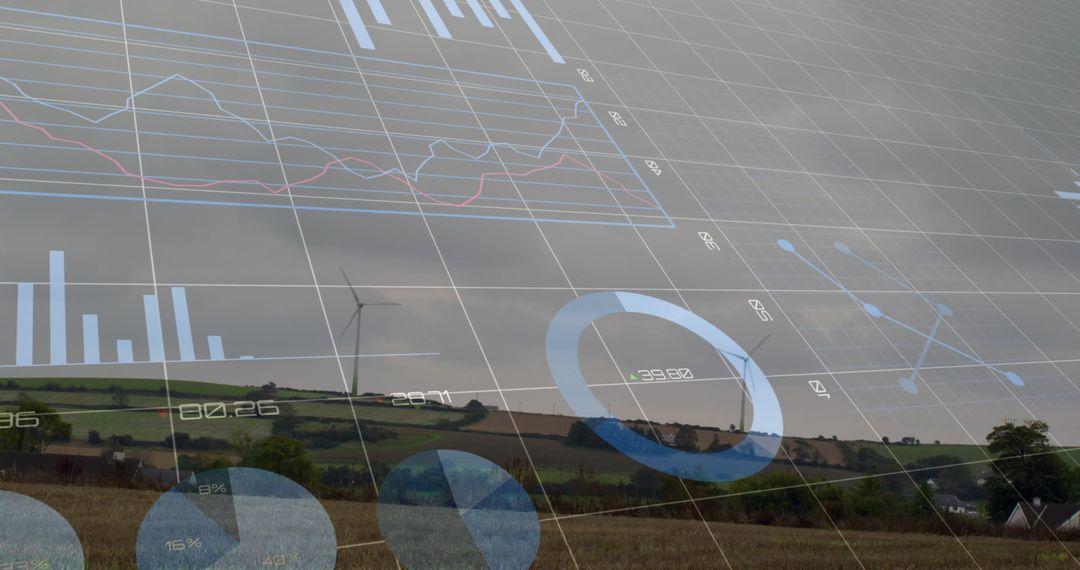
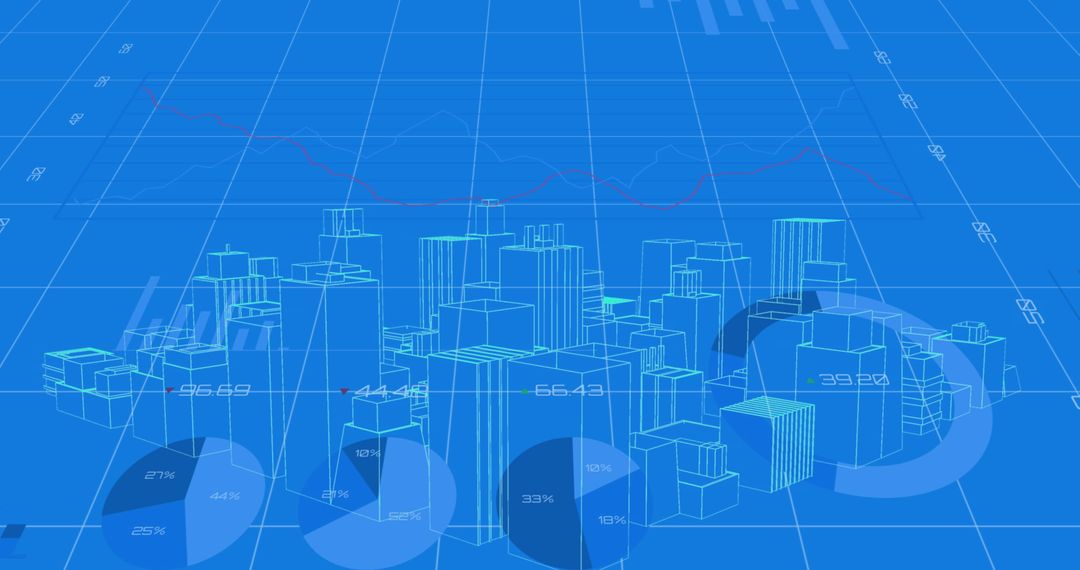
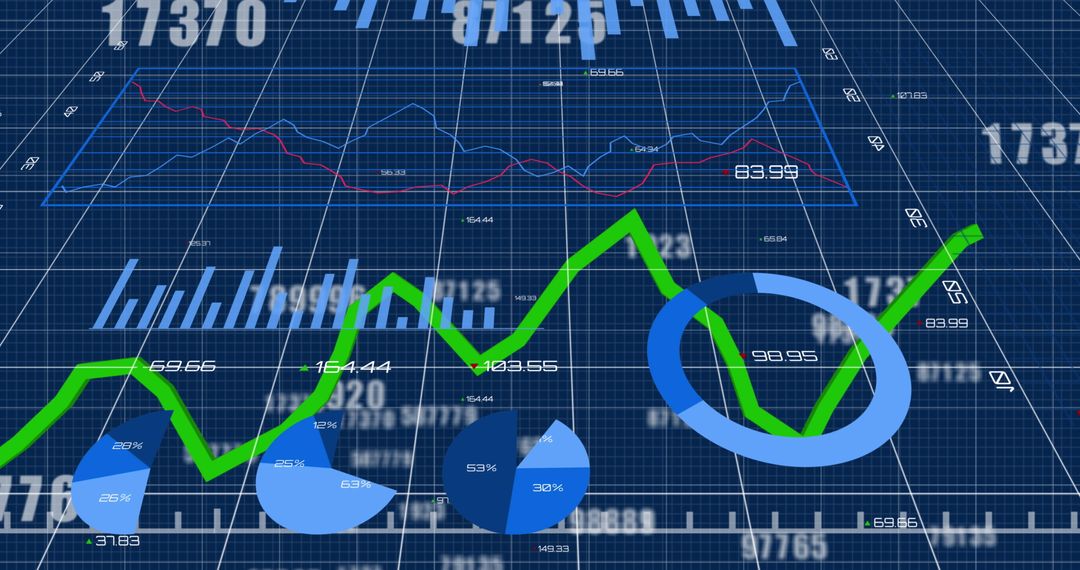
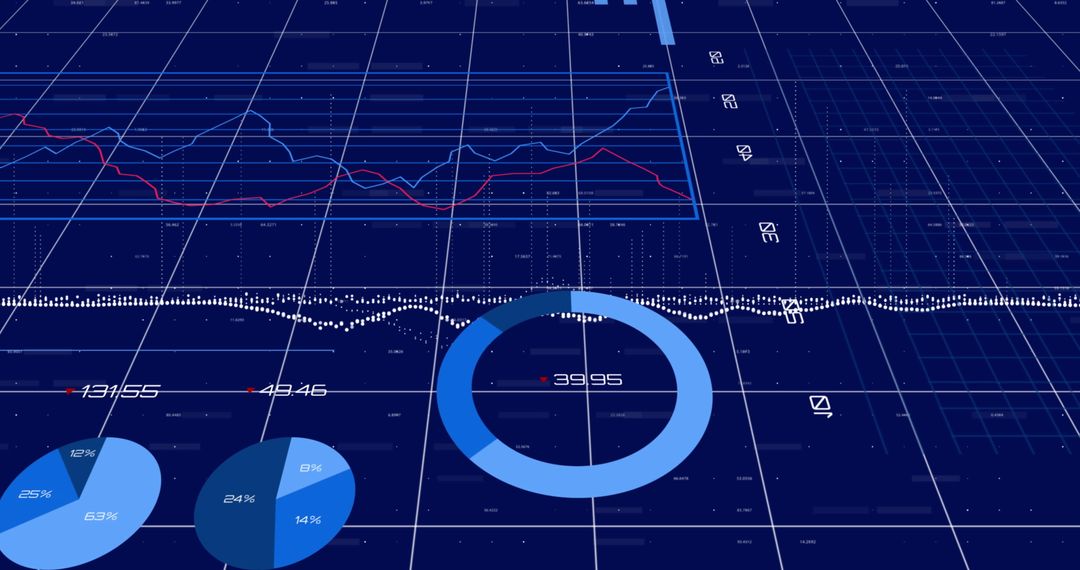
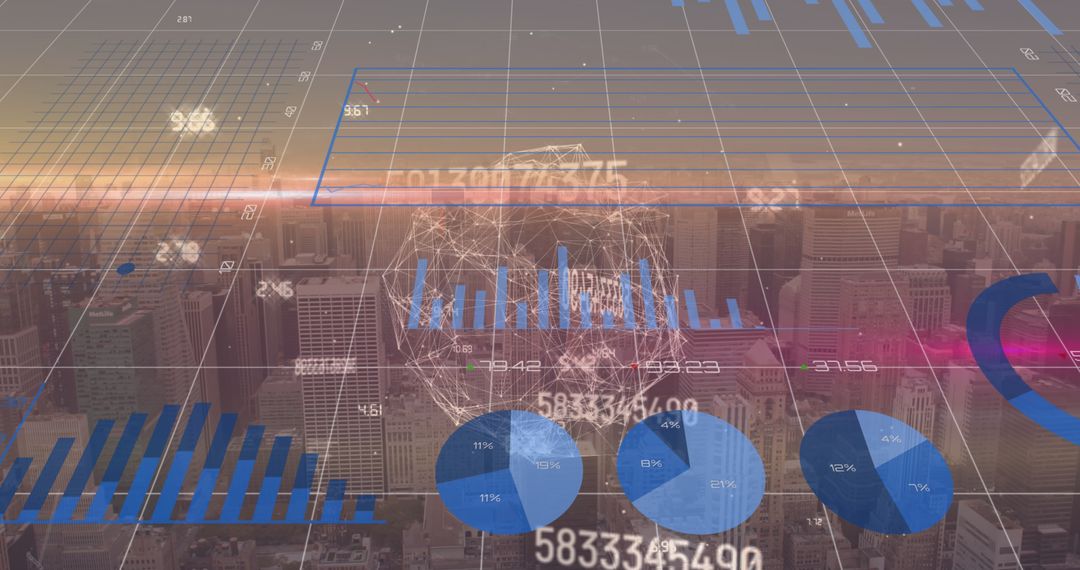
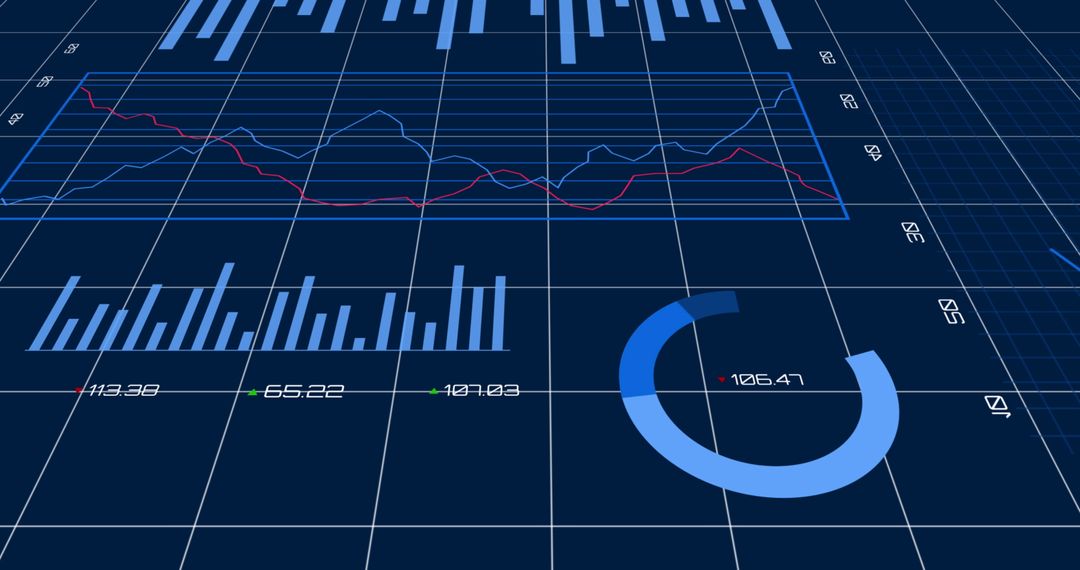
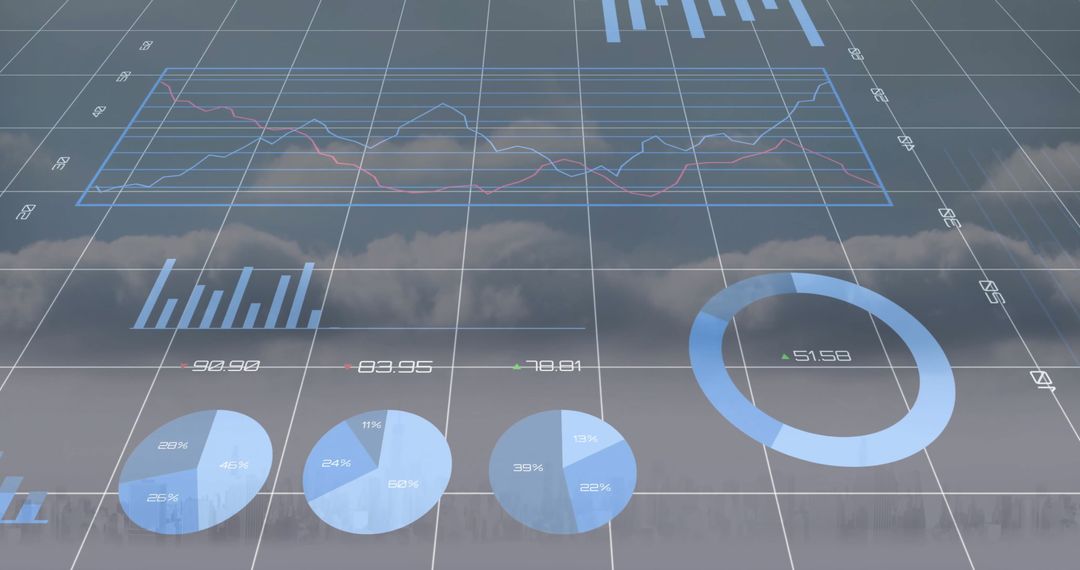
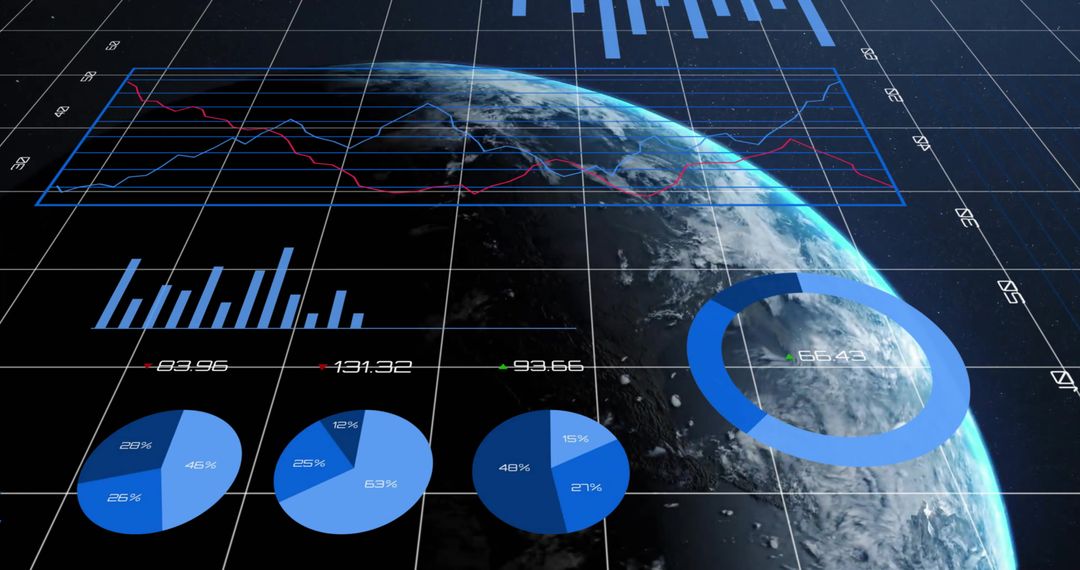
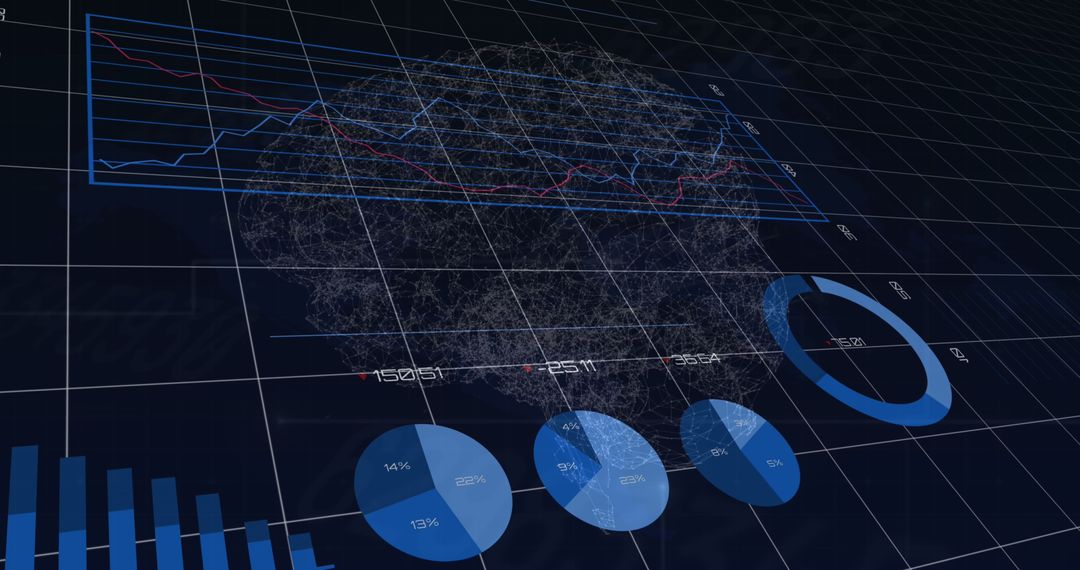
- Financial Data Analysis with Cityscape View: Global Business Concept
Financial Data Analysis with Cityscape View: Global Business Concept Image
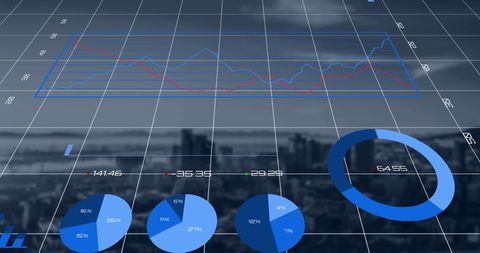
Financial statistics shown with a translucent digital chart overlay implying urban economic settings. Useful for materials related to economics, business analysis, and financial reports. Ideal visualization of global commerce tied to urban centers.
Powered by  - Get 15% off with code: PIKWIZARD15


0
downloads
downloads
Tags:
More
Credit Photo
If you would like to credit the Photo, here are some ways you can do so
Text Link
photo Link
<span class="text-link">
<span>
<a target="_blank" href=https://pikwizard.com/photo/financial-data-analysis-with-cityscape-view-global-business-concept/692d091e47b77ae2dbe7c97a22eb43d7/>PikWizard</a>
</span>
</span>
<span class="image-link">
<span
style="margin: 0 0 20px 0; display: inline-block; vertical-align: middle; width: 100%;"
>
<a
target="_blank"
href="https://pikwizard.com/photo/financial-data-analysis-with-cityscape-view-global-business-concept/692d091e47b77ae2dbe7c97a22eb43d7/"
style="text-decoration: none; font-size: 10px; margin: 0;"
>
<img src="https://pikwizard.com/pw/medium/692d091e47b77ae2dbe7c97a22eb43d7.jpg" style="margin: 0; width: 100%;" alt="" />
<p style="font-size: 12px; margin: 0;">PikWizard</p>
</a>
</span>
</span>
Free (free of charge)
Free for personal and commercial use.
Author: People Creations
Similar Free Stock Images

Premium


Premium


Premium


Premium


Premium


Premium


Premium


Premium


Premium


Premium


Premium


Premium


Premium


Premium


Premium


Premium


Premium


Premium


Premium


Premium


Premium


Premium


Premium


Premium