1. Home > 
  2. Stock Photos > 
  3. Financial Data Analysis with Cloud Technology Integration

Financial Data Analysis with Cloud Technology Integration Image

Financial Data Analysis with Cloud Technology Integration

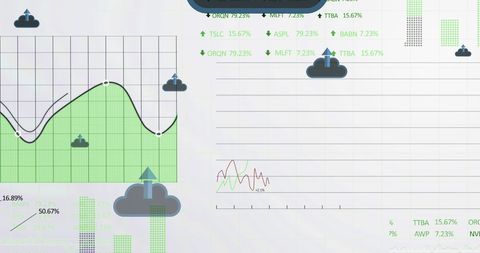
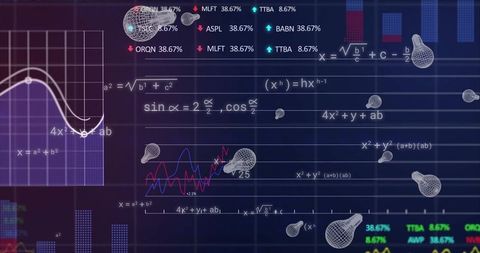
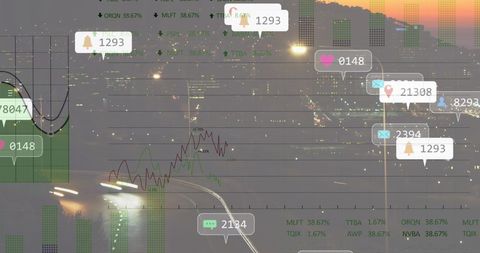
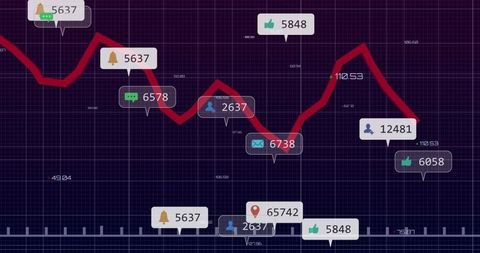
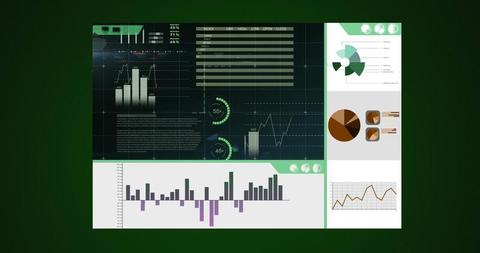
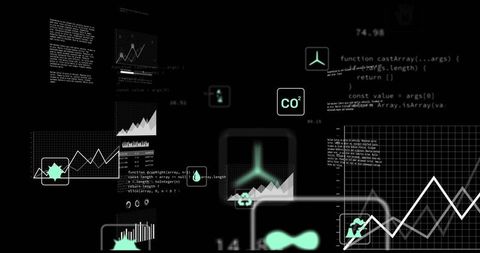
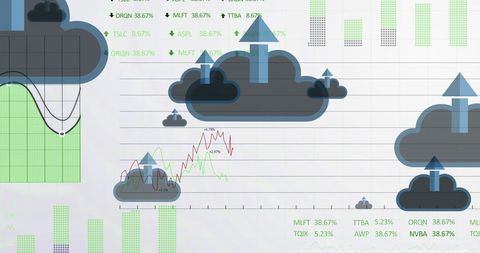
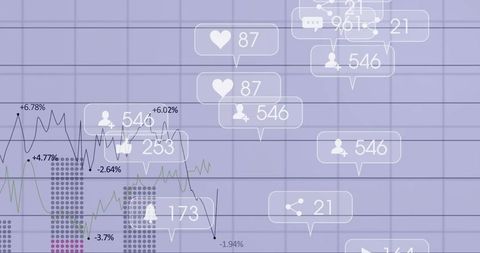
Various graphs and charts illustrate the use of cloud technology in financial data analysis and global business operations. Elements like clouds and arrows emphasize digital transformation and data flow, sequential increase focus evident with percentage highlights. Suitable for presentations on fintech, trends in digital finance, and cloud-based business solutions.

Powered by Adobe logo
Concept of big data processing and analysis using big data architecture enables insights, big data visualization, and big data integration. Gist - Powered by AdobeBig data and AI technology, Business intelligence and AI data science, Automating data processing, Machine learning and business intelligence, AI driven data processing, KPI performance monitoring. - Powered by AdobeVibrant digital data stream and analytics visualization with glowing blue and pink waves, representing modern technology and connectivity. generative ai - Powered by AdobeGlowing futuristic 2026 digital number with swirling neon data flow and technology icons, concept for future trends, business innovation and digital transformation - Powered by AdobeBusinessman managing invoices with laptop, modern technology for efficient accounting and finance - Powered by Adobe

Credit Photo

If you would like to credit the Photo, here are some ways you can do so

Free (free of charge)

Free for personal and commercial use.

Author: People Creations

Similar Free Stock Images

Global Data Analytics and Network Visualization on Digital Grid
Premium
AI integration system connecting data, cloud, automation, API, and analytics through a central AI core, futuristic glowing circuit lines, Holographic UI overlay for business and technology solutions
Digital Display of Financial Data with Graph and Figures
Premium
AI agent and generative artificial intelligence concept. Businessman using AI agents on screen including chatbots, AI assistants, and data analytics tools on a laptop. LLM, Ai agentic workflows. ML.
Digital Stock Market Trends and Financial Growth Analysis
Dynamic Data Analytics Interface Showing Statistical Trends
Premium
A digital rendering of a neoclassical building, integrated with a futuristic technology design, showcasing interconnected systems and data
Futuristic Financial Data Visualization
Financial Data Processing with Graphs and Charts Overlay
Financial Data Projection in Modern Office Space
Digital Projection of Financial Data with Bar Graphs
Premium
Digital document folders showing data flow and cloud storage on a circuit board background for concept of secure information transfer.
Premium
Futuristic holographic data hub with glowing blue towers and floating analytical dashboards displaying charts and graphs.
Stock Market Analysis with Graphs and Trading Data
Digital Finance Interface with Data Visualization on Blue Background
Digital Stock Market with Cloud Icons over City Skyline at Night
Digital Financial Data and Global Analytics Interface
Premium
Confident professional with digital document management system thumbs up, data success
Digital Interface Displaying Stock Market Data and Statistics
Financial Data Analytics on Digital Interface
Global Technology Digital Interface with Data Analytics Display
Abstract Digital Graphs and Math Formulas Overlay on Dark Background
Premium
AI-powered tax e-filing and fintech automation concept with digital interface, calculator, and laptop. Smart tax compliance, accounting technology, and financial intelligence.
Premium
Hands Holding Abstract Blue and Red Data Visualization.
Digital Data Processing Displaying Financial Charts and Code
Data Projection Over Cityscape Indicating Digital Economy
Dark Financial Dashboard Displaying Real-Time Analytics, Index Table, Americas Map, Gauges
Digital Data Analytics Interface with Graphs and Code
Medical Research Enabled by Dynamic Technology and Data
Digital Data Analysis with Futuristic Charts
Digital Financial Data Stream with Numeric Overlay
Premium
Digital Transformation: Businesswoman Navigating Data-Driven Insights, Futuristic Interface
Digital Financial Data Analysis with Infographics and Charts
Eco Data Visualization with Environmental Icons and Graphs
Digital Stock Market Data and Analytics on Screen
Analyzing Digital Graphs Highlighting Financial Data Trends
Digital Data Analysis Interface with Graphs
Data Visualization Interface with Analytics and Trend Line on Digital Grid
Digital Financial Data Interface with Analytics
Premium
Futuristic digital interface overlaying a cityscape, showcasing data visualization and global connections.
Premium
Financial Network Connectivity: The central motif is a detailed depiction of interconnected financial networks.
Data Processing Overlaid on Graphs and Code in Digital Interface
Dynamic Financial Data Chart with Rising Growth Indicator
Financial Graphs and World Map Illustrating Market Data
Dynamic Financial Charts and Data for Market Analysis
Premium
Digital document verification and approval process represented by glowing neon icon with network background for secure online systems
Futuristic Data Visualization with Teal Nodes and Stock Charts
Dynamic Statistical Data Over Grid Network Isolated on White
Digital Financial Data Display with Graphs and Analytics
Digital Financial Data Interface with Graphs and Trends
Premium
Artificial intelligence and technology are driving digital innovation. Human brain connects with global data and network systems, smart future solutions for business growth and across modern society.
Graphical Display of Stock Market Trends with Gradient Background
Financial Data Charts & Analysis on Dark Screen
Digital Display of Financial Data and Statistics
Financial Data Analytics with Graphs and statistics
Abstract Digital Data Charts and Graphs on Screen
Abstract Financial Growth and Data Analysis
Digital Data Interface with Global Financial Statistics
Stock Market Data and Statistics against Cloudy Sky Background
Graph and Chart Display on White Grid Background
Digital Financial Data Analytics with Graphs and Codes
Stock Market Analysis Digital Screen with Graphs and Trends
Digital Data and Arrows Showcasing Market Trends
Dynamic Digital Data Visualization with Graphs and Statistics
Digital Data Dashboard with Interactive Charts
Premium
Business women and graphs on tablet screen for finance results, profit growth and budget review. Staff, team and digital with financial report, revenue stats and dividend comparison of risk assessment
Diverse Graphs and Data Over Urban Landscape
Premium
Payroll management solution with digital icons popping out of a laptop screen, Seamless payroll processing for optimized financial efficiency and compliance
Stock Market Data Visualization Overlay Arena Shows Global Financial Analytics
Digital Interface with Data Graphs and Media Icons
Digital Interface with Overlapping Code and Graph
Futuristic Analytics Dashboard Displaying Line Chart, Sparklines, Notification Badges and Realtime M
Premium
Business professionals collaborating on cybersecurity strategy, surrounded by technology and finance documents, with digital security icons illustrating data protection.
Global Financial Data Visualizations with Charts and World Map
Digital Data Processing with Technology Interface on Blue Background
Futuristic Financial Data Analytics with Digital Interface Concept
Data Analysis Charts and Graphs on Digital Interface
Premium
concept of artificial intelligence and data analysis, businessman demonstrates virtual interface of graph and holographic AI brain on hand, conveying future technology and intelligent work assistants
Comprehensive Financial Data Analytics Interface with Global Indicators
Stylized Graphs and Charts on White Background for Data Analysis Concepts
Financial Data Processing with Charts and Graphics on Digital Blue Background
Financial Analytics Display with Digital Graphs and Charts
Premium
Concept of big data processing and analysis using big data architecture enables insights, big data visualization, and big data integration. Entice
Digital Financial Data Interface on Green Background
Digital Fintech Visualization with Graphs and Data Icons
Digital Interface Showing Data Analytics with Graphs and Charts
Financial Data Processing Visualization on Dark Background
Premium
Regtech, Regulatory technology concept, management of regulatory processes with financial industry through technology, Regulatory monitoring, reporting and compliance, Machine learning tech.
Digital Financial Data Processing Interface on Red Background
Futuristic Financial Data Analysis with Graphs and Charts
Abstract Business Technology Data Presentation
Premium
Hands working on laptop with cloud computing concept, data storage and modern technology
Financial Visualization Overlooking Urban Cityscape
Global Financial Analytics and Data over Digital World Map
Digital Finance Data with Arrows and Cloud Icons
Healthcare and Finance Synergy with Data Visualization
Futuristic Financial Data Analysis in Green Tones
Digital Interface with Data Graphs and Charts
Global Financial Data Analytics and Economic Graphs
Futuristic Neon Energy Dashboard Showing Turbine Icon, CO2 Readout, Code Snippets and Data Charts
Digital Security and Financial Data Trends
Dynamic Financial Data Charts and Digital Interface Concepts
Digital Financial Data Analysis on Futuristic Blue Interface
Holographic Currency Charts and Digital Data Flow in Financial Market
Digital Financial Data Analytics on Dark Interface
Digital Shield Padlock for Global Internet Security
Futuristic Dashboard with Analytics and Social Metrics
Futuristic Financial Data Analysis Interface Concept
Digital Data Processing Dashboard in Global Connection Visualization
Digital Financial Data Analysis with Graphs and Charts
Premium
Futuristic data center managing big data and financial market analytics
Digital Financial Statistics and Analytics Visualization with Graphs
Digital Data Streams and Analytics Visualization
Global Economy and Stock Market Data Concept Visualization
Global Financial Data Processing with Digital Interface Elements
Premium
Businessman holding digital risk assessment gauge icon for security management,insurance and financial protection planning,safety level analysis,investment control,business analytics
Digital Dashboard with Line Charts and Data Analytics Visualization
Digital Finance Analytics in Modern Business Environment
Financial Data Processing with Graphs and Charts Background
Finance and Technology Concept with Holographic Graphs
Premium
AI data analytics dashboard, business data insights, AI-powered data analysis dashboard, business strategy, Analyst or Scientist uses a computer and dashboard for analysis of information development
Premium
Business women and graphs on tablet screen for finance results, profit growth and budget review. Staff, team and digital with financial report, revenue stats and dividend comparison of risk assessment
Social Media Integration in Cityscape with Digital Analytics
Premium
Close-up of stacked paper documents with bokeh particles radiating from the top edge, suggesting data transfer
Holographic Stock Market Analysis with Charts and Data
Explore More Free Stock Images