
- Home >
- Stock Photos >
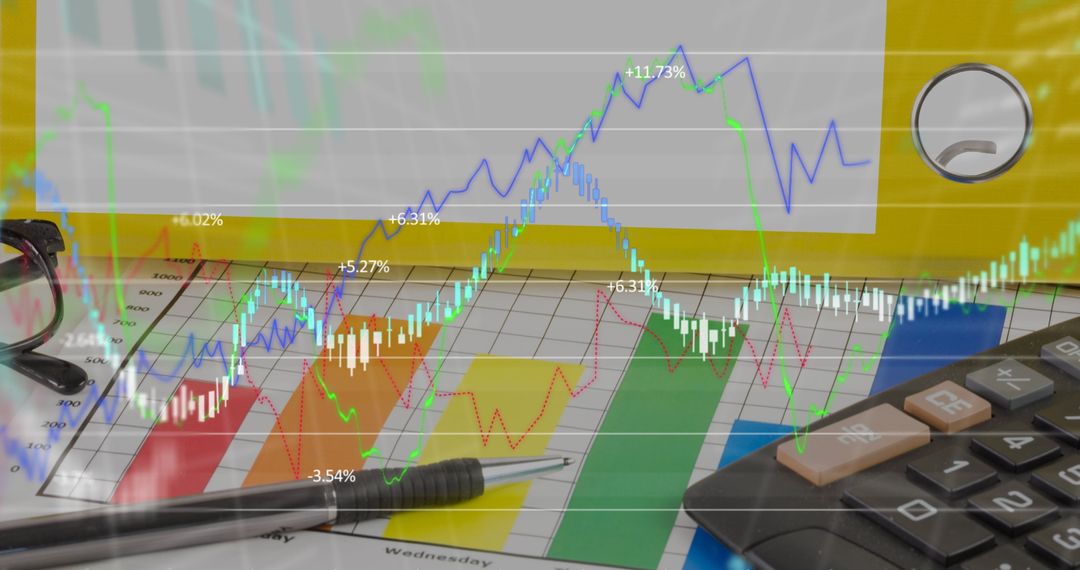
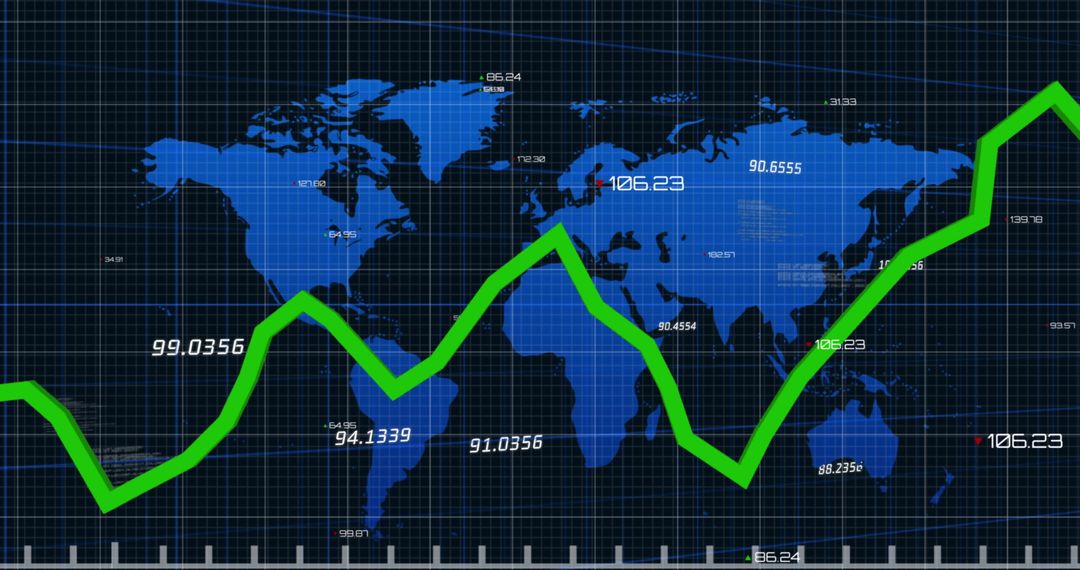
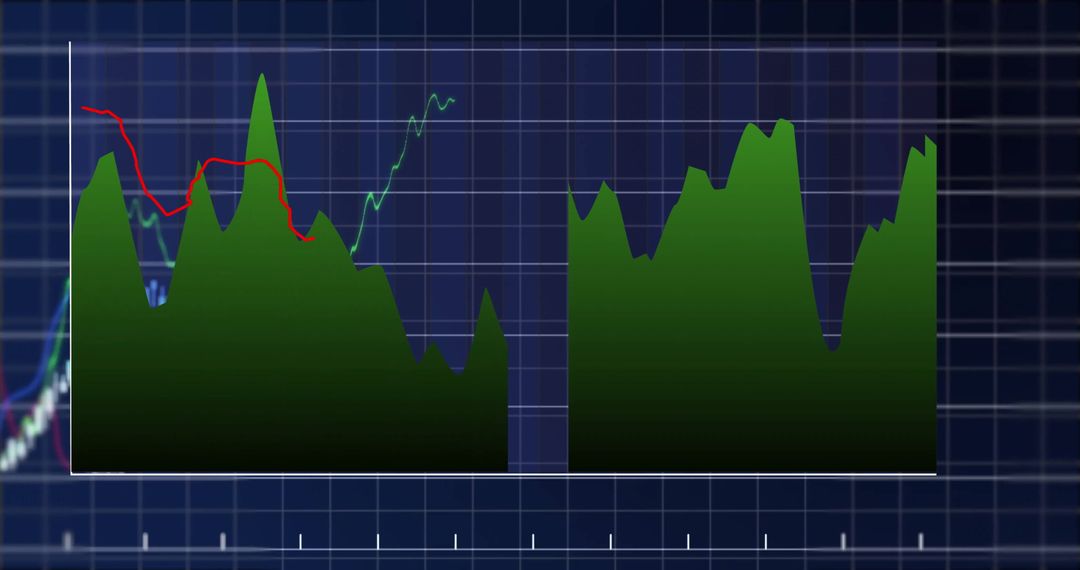
- Financial Data Analysis with Colorful Trends and Graphs
Financial Data Analysis with Colorful Trends and Graphs Image

Visual represents a financial workspace with colorful graphs statistically analyzing market trends. Useful for business presentations, reports, global finance insights, trade publications, or articles focused on investment strategies.
Powered by 


2
downloads
downloads
Tags:
More
Credit Photo
If you would like to credit the Photo, here are some ways you can do so
Text Link
photo Link
<span class="text-link">
<span>
<a target="_blank" href=https://pikwizard.com/photo/financial-data-analysis-with-colorful-trends-and-graphs/a4ee6e2cd00baa68095d9b7299a17780/>PikWizard</a>
</span>
</span>
<span class="image-link">
<span
style="margin: 0 0 20px 0; display: inline-block; vertical-align: middle; width: 100%;"
>
<a
target="_blank"
href="https://pikwizard.com/photo/financial-data-analysis-with-colorful-trends-and-graphs/a4ee6e2cd00baa68095d9b7299a17780/"
style="text-decoration: none; font-size: 10px; margin: 0;"
>
<img src="https://pikwizard.com/pw/medium/a4ee6e2cd00baa68095d9b7299a17780.jpg" style="margin: 0; width: 100%;" alt="" />
<p style="font-size: 12px; margin: 0;">PikWizard</p>
</a>
</span>
</span>
Free (free of charge)
Free for personal and commercial use.
Author: People Creations
Similar Free Stock Images

Premium


Premium


Premium


Premium


Premium


Premium


Premium


Premium


Premium


Premium


Premium


Premium


Premium


Premium


Premium


Premium


Premium


Premium


Premium


Premium


Premium


Premium


Premium


Premium

