- Home >
- Stock Photos >
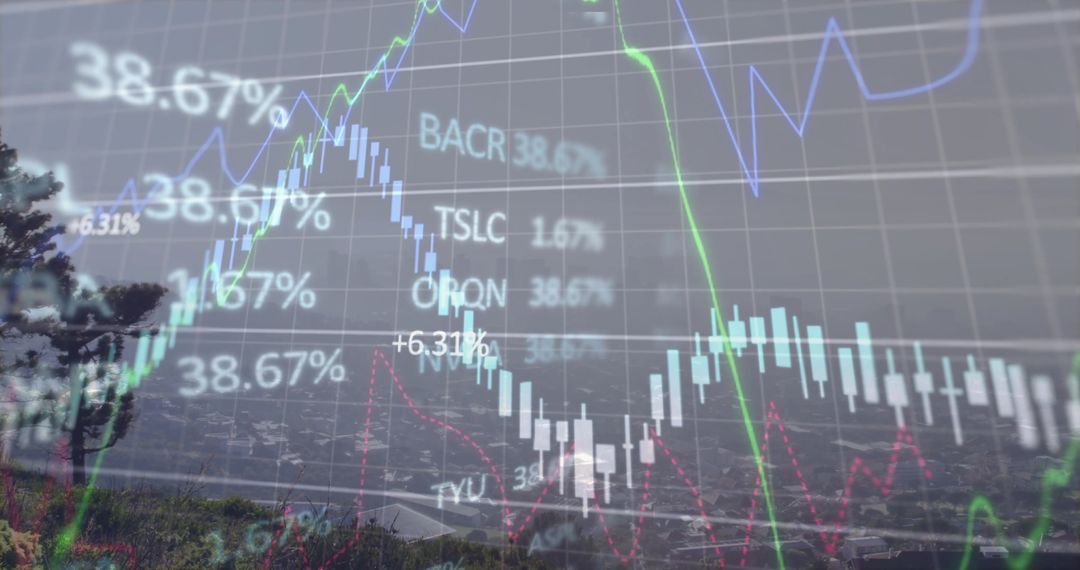
- Financial Data Analysis with Detailed Stock Chart Visual
Financial Data Analysis with Detailed Stock Chart Visual Image

Depicts dynamic financial charts and data over total dark background. Ideal for illustrating business growth, stock market analysis, or financial reports as it effectively represents complicated data analytics and global investment strategies. Useful for financial advisories, online business reports, and educational material stressing economic trends.
Powered by  - Get 15% off with code: PIKWIZARD15


2
downloads
downloads
Tags:
More
Credit Photo
If you would like to credit the Photo, here are some ways you can do so
Text Link
photo Link
<span class="text-link">
<span>
<a target="_blank" href=https://pikwizard.com/photo/financial-data-analysis-with-detailed-stock-chart-visual/66b71c615d00eca3852a70f3387a8ee9/>PikWizard</a>
</span>
</span>
<span class="image-link">
<span
style="margin: 0 0 20px 0; display: inline-block; vertical-align: middle; width: 100%;"
>
<a
target="_blank"
href="https://pikwizard.com/photo/financial-data-analysis-with-detailed-stock-chart-visual/66b71c615d00eca3852a70f3387a8ee9/"
style="text-decoration: none; font-size: 10px; margin: 0;"
>
<img src="https://pikwizard.com/pw/medium/66b71c615d00eca3852a70f3387a8ee9.jpg" style="margin: 0; width: 100%;" alt="" />
<p style="font-size: 12px; margin: 0;">PikWizard</p>
</a>
</span>
</span>
Free (free of charge)
Free for personal and commercial use.
Author: Awesome Content
Similar Free Stock Images

Premium


Premium


Premium


Premium


Premium


Premium


Premium


Premium


Premium


Premium


Premium


Premium


Premium


Premium


Premium


Premium


Premium


Premium


Premium


Premium


Premium


Premium


Premium


Premium