- Home >
- Stock Photos >
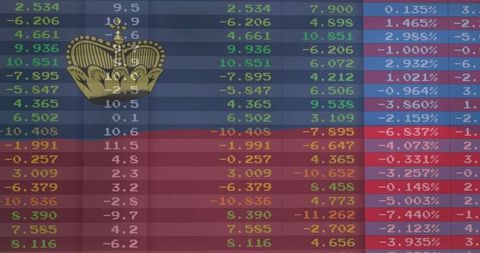
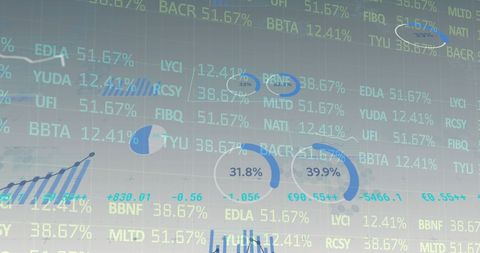
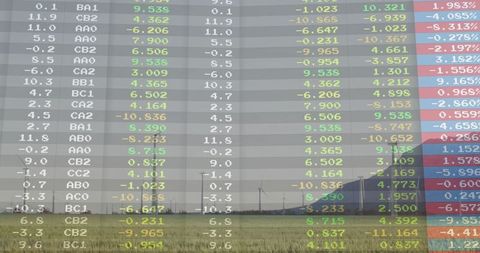
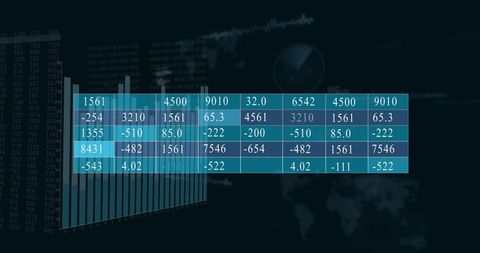
- Financial Data Analysis with Digital Chart Overlay in Blue Tones
Financial Data Analysis with Digital Chart Overlay in Blue Tones Image

Image shows multiple layers of financial data including charts and numbers dynamically displayed in blue hues. Useful for illustrating concepts connected to economics, trading strategies, stock analysis, or presenting business reports to visually capture the essence of financial markets.
Powered by 


downloads
Tags:
More
Credit Photo
If you would like to credit the Photo, here are some ways you can do so
Text Link
photo Link
<span class="text-link">
<span>
<a target="_blank" href=https://pikwizard.com/photo/financial-data-analysis-with-digital-chart-overlay-in-blue-tones/16959696af1ddff3bd3add55807b094f/>PikWizard</a>
</span>
</span>
<span class="image-link">
<span
style="margin: 0 0 20px 0; display: inline-block; vertical-align: middle; width: 100%;"
>
<a
target="_blank"
href="https://pikwizard.com/photo/financial-data-analysis-with-digital-chart-overlay-in-blue-tones/16959696af1ddff3bd3add55807b094f/"
style="text-decoration: none; font-size: 10px; margin: 0;"
>
<img src="https://pikwizard.com/pw/medium/16959696af1ddff3bd3add55807b094f.jpg" style="margin: 0; width: 100%;" alt="" />
<p style="font-size: 12px; margin: 0;">PikWizard</p>
</a>
</span>
</span>
Free (free of charge)
Free for personal and commercial use.
Author: Creative Art
Similar Free Stock Images
Loading...

Premium


Premium

Premium

Premium


Premium


Premium


Premium


Premium

Premium


Premium


Premium


Premium


Premium


Premium


Premium


Premium

Premium


Premium

Premium


Premium


Premium


Premium


Premium


Premium


Premium