- Home >
- Stock Photos >
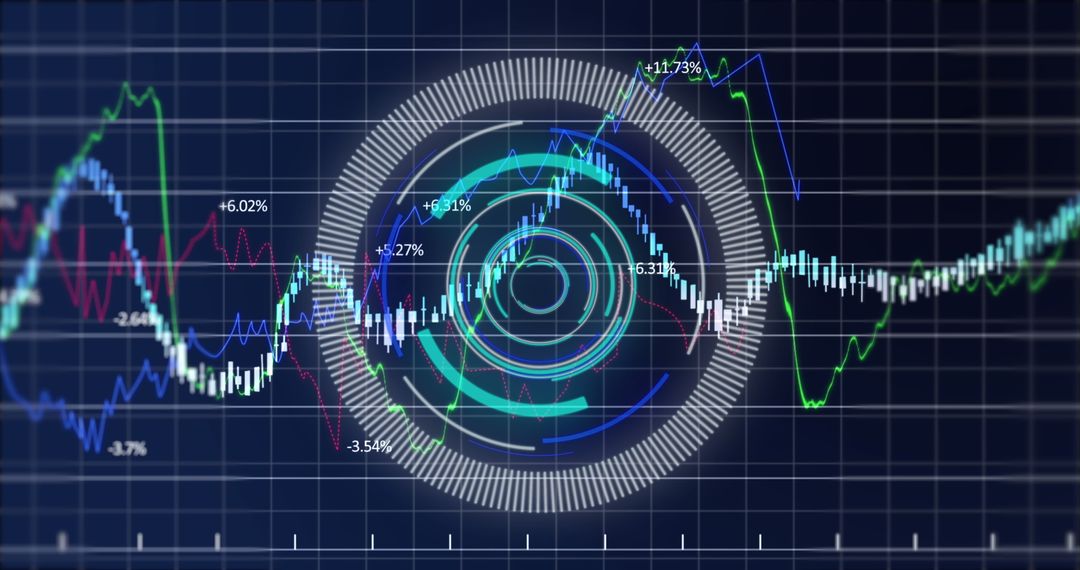
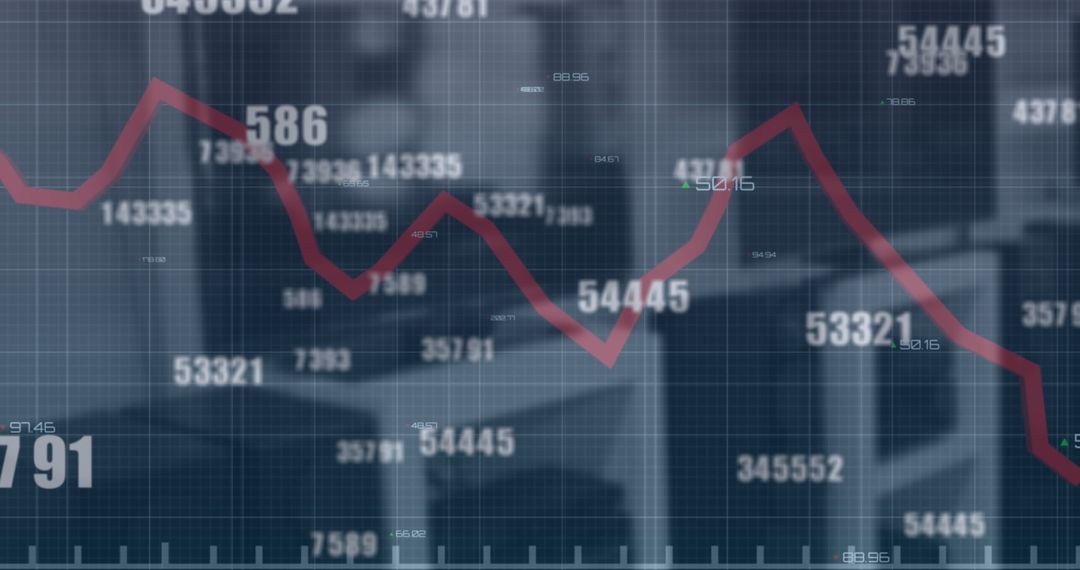
- Financial Data Analysis with Digital Graphs and Charts Overlay
Financial Data Analysis with Digital Graphs and Charts Overlay Image

This image presents a dynamic visualization of financial data with digital graphs and charts overlay set on a blue background, reflecting themes of global business and economic analysis. Useful for illustrating articles related to finance, investment trends, data analytics, and business intelligence. The image can enhance presentations related to economic forecasts and financial reports.
Powered by 


0
downloads
downloads
Tags:
More
Credit Photo
If you would like to credit the Photo, here are some ways you can do so
Text Link
photo Link
<span class="text-link">
<span>
<a target="_blank" href=https://pikwizard.com/photo/financial-data-analysis-with-digital-graphs-and-charts-overlay/d01005c01caf4b812ac70f5d907e3003/>PikWizard</a>
</span>
</span>
<span class="image-link">
<span
style="margin: 0 0 20px 0; display: inline-block; vertical-align: middle; width: 100%;"
>
<a
target="_blank"
href="https://pikwizard.com/photo/financial-data-analysis-with-digital-graphs-and-charts-overlay/d01005c01caf4b812ac70f5d907e3003/"
style="text-decoration: none; font-size: 10px; margin: 0;"
>
<img src="https://pikwizard.com/pw/medium/d01005c01caf4b812ac70f5d907e3003.jpg" style="margin: 0; width: 100%;" alt="" />
<p style="font-size: 12px; margin: 0;">PikWizard</p>
</a>
</span>
</span>
Free (free of charge)
Free for personal and commercial use.
Author: People Creations
Similar Free Stock Images

Premium


Premium


Premium


Premium


Premium


Premium


Premium


Premium


Premium


Premium


Premium


Premium


Premium


Premium


Premium


Premium


Premium


Premium


Premium


Premium


Premium


Premium


Premium


Premium