- Home >
- Stock Photos >
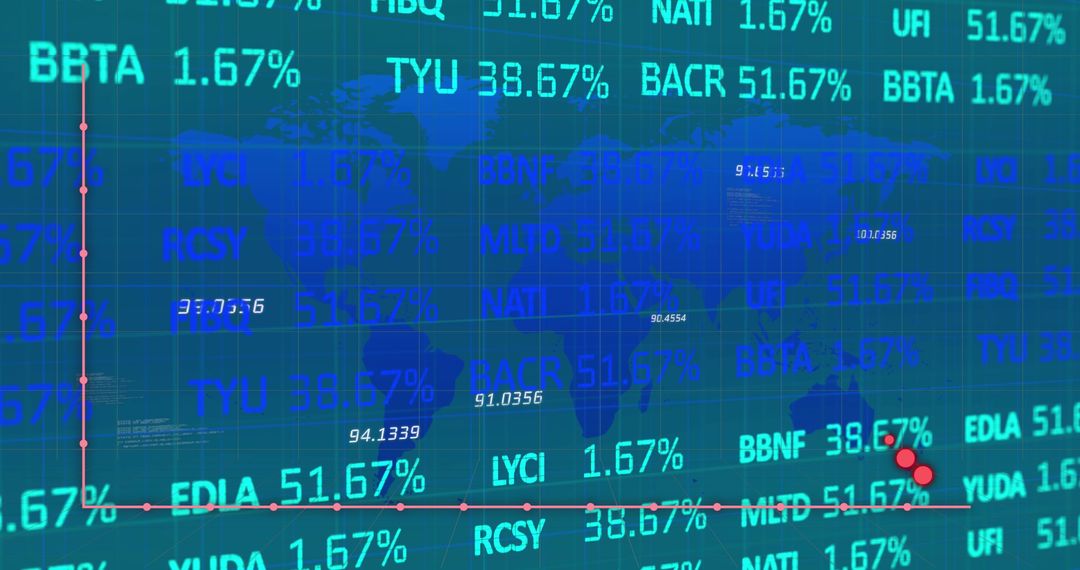
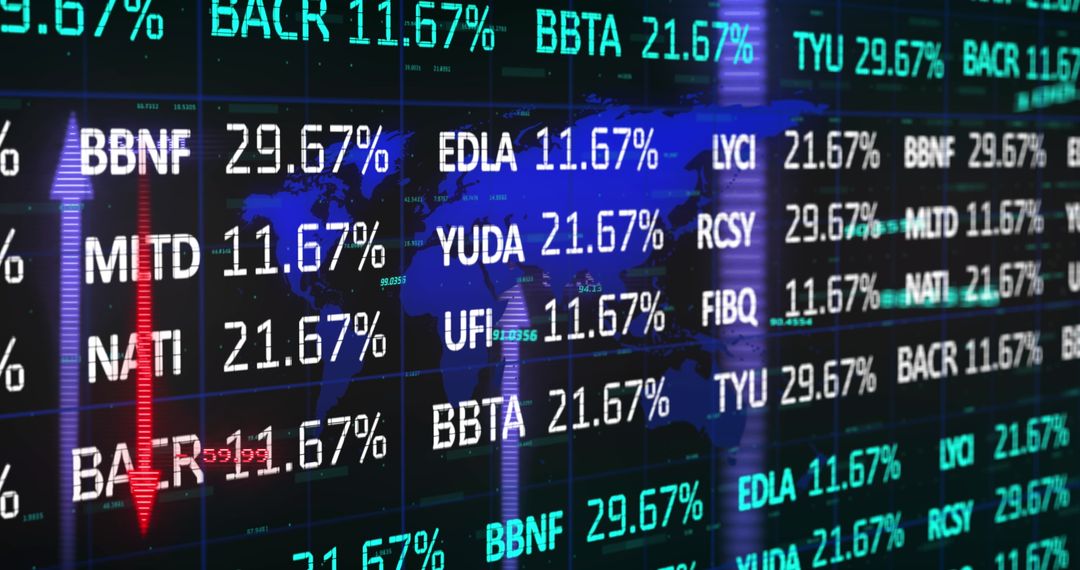
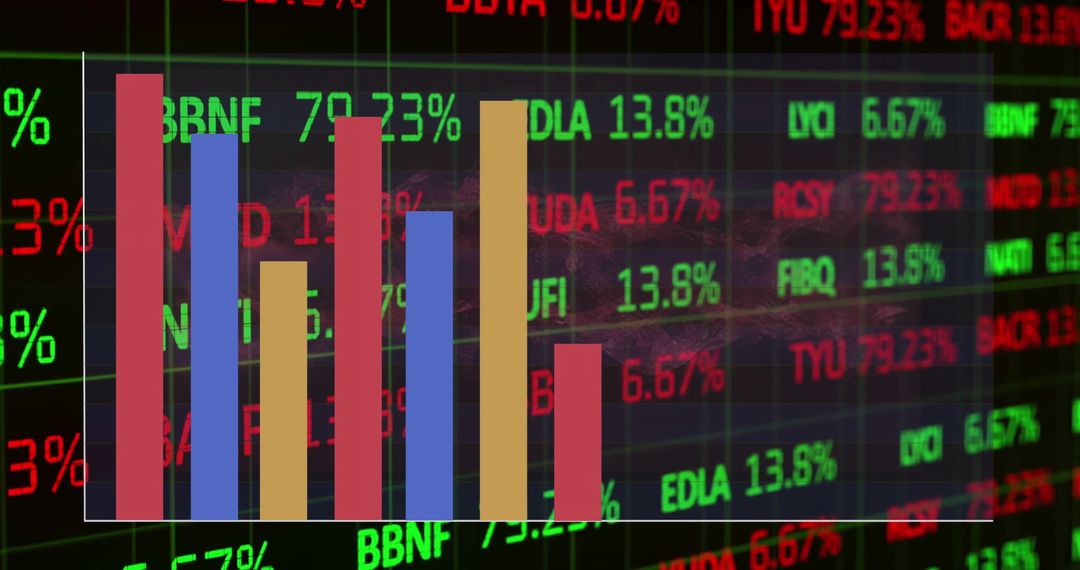
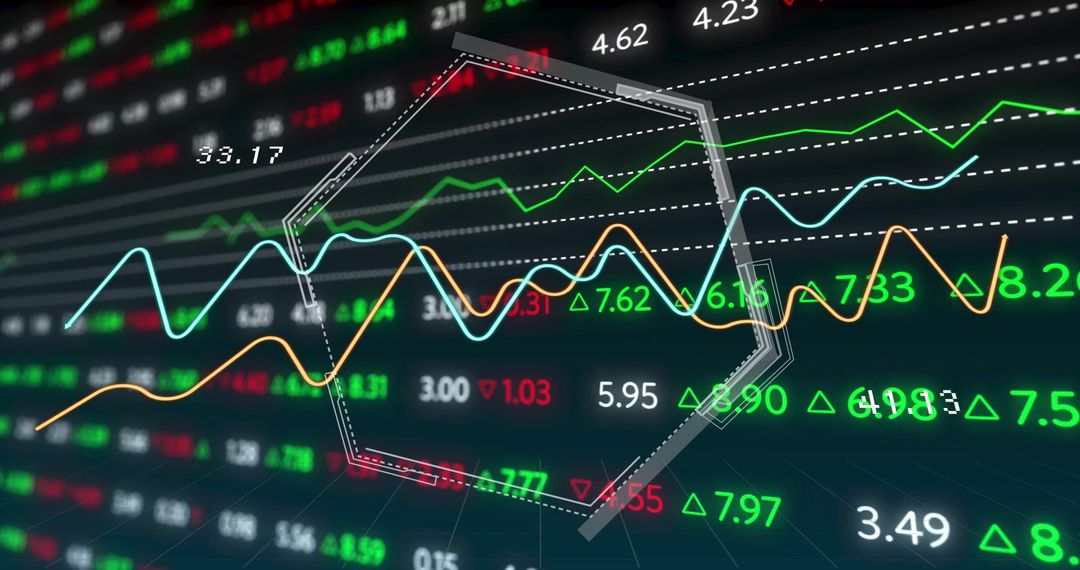
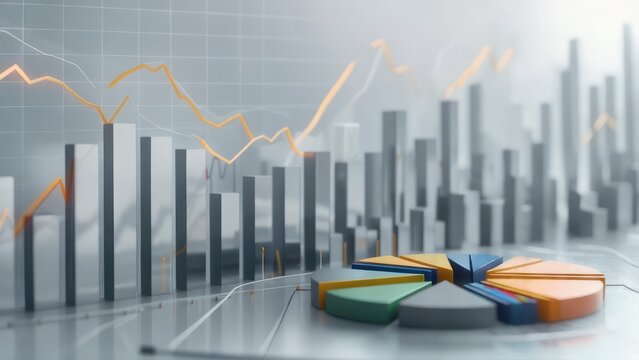
- Financial Data Analysis with Digital Graphs and Charts
Financial Data Analysis with Digital Graphs and Charts Image
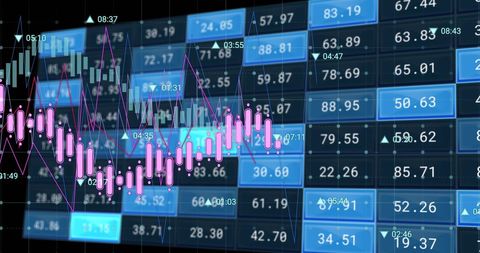
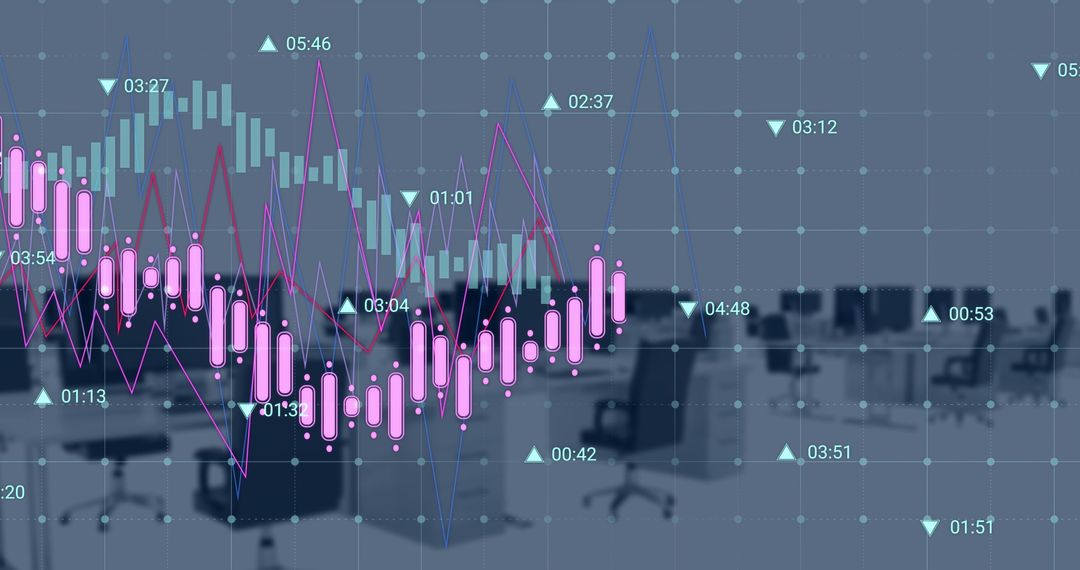
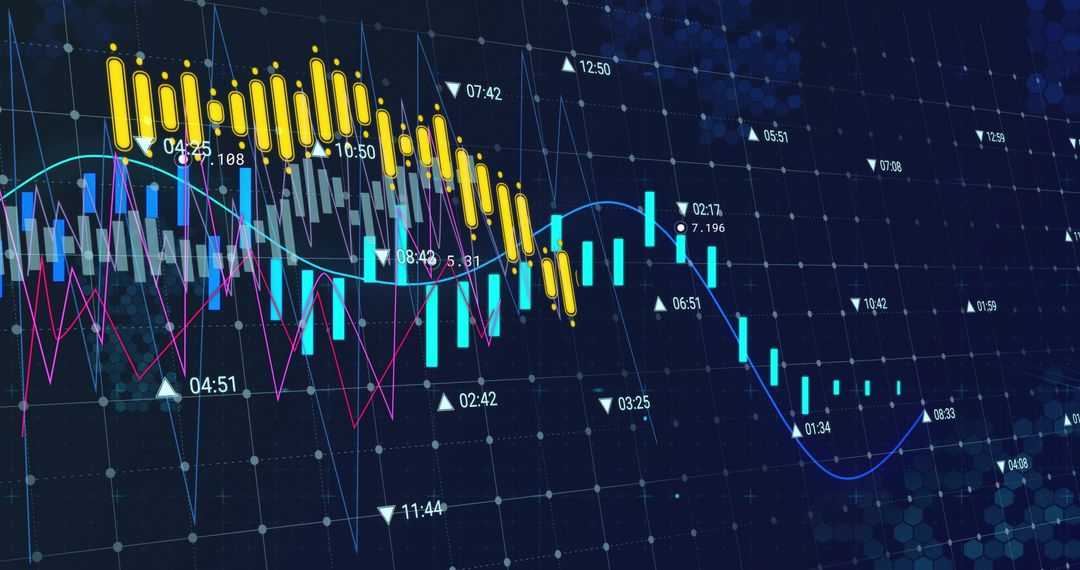
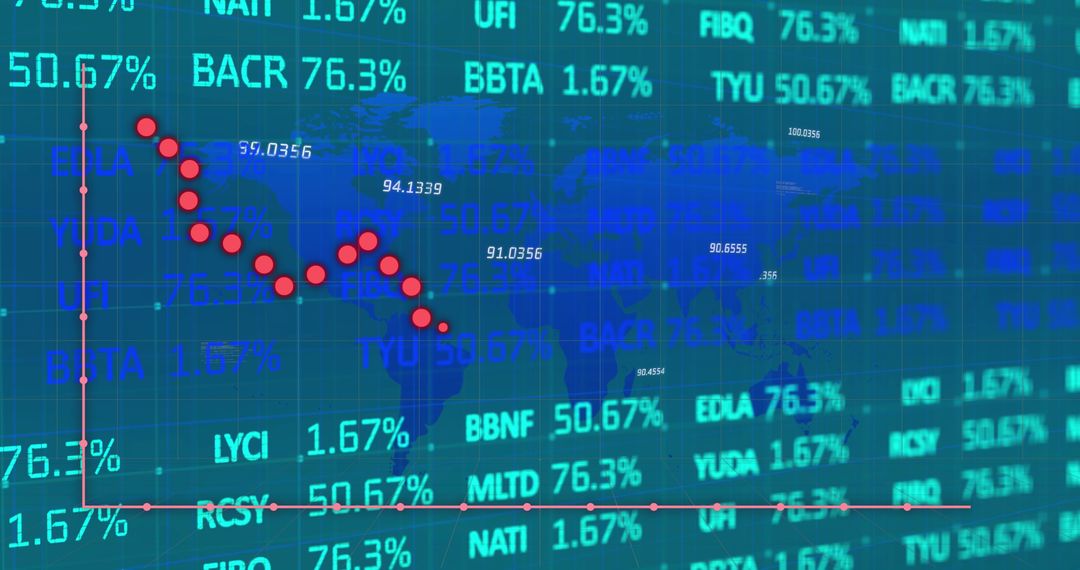
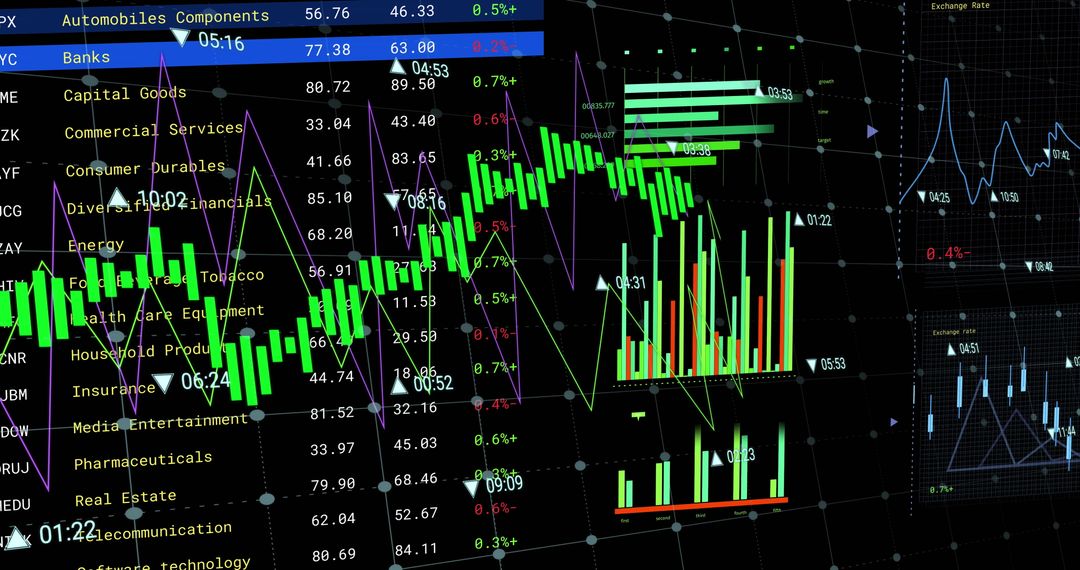
Perfect for articles or presentations related to finance, investments, or trading. Can be used in blogs discussing market trends or entrepreneurial insights. Ideal for depicting a technology-driven business environment.
Powered by 


6
downloads
downloads
Tags:
More
Credit Photo
If you would like to credit the Photo, here are some ways you can do so
Text Link
photo Link
<span class="text-link">
<span>
<a target="_blank" href=https://pikwizard.com/photo/financial-data-analysis-with-digital-graphs-and-charts/71437bcb87e6454234cb26a7edbea43d/>PikWizard</a>
</span>
</span>
<span class="image-link">
<span
style="margin: 0 0 20px 0; display: inline-block; vertical-align: middle; width: 100%;"
>
<a
target="_blank"
href="https://pikwizard.com/photo/financial-data-analysis-with-digital-graphs-and-charts/71437bcb87e6454234cb26a7edbea43d/"
style="text-decoration: none; font-size: 10px; margin: 0;"
>
<img src="https://pikwizard.com/pw/medium/71437bcb87e6454234cb26a7edbea43d.jpg" style="margin: 0; width: 100%;" alt="" />
<p style="font-size: 12px; margin: 0;">PikWizard</p>
</a>
</span>
</span>
Free (free of charge)
Free for personal and commercial use.
Author: Authentic Images
Similar Free Stock Images

Premium


Premium


Premium


Premium


Premium


Premium


Premium


Premium


Premium


Premium


Premium


Premium


Premium


Premium


Premium


Premium


Premium


Premium


Premium


Premium


Premium


Premium


Premium


Premium