
- Home >
- Stock Photos >
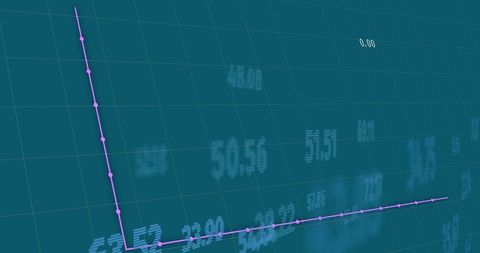
- Financial Data Analysis with Digital Grid Overlay
Financial Data Analysis with Digital Grid Overlay Image

Featuring a futuristic grid background with a prominent bar chart line, this visualization encapsulates the intersection of finance and technology. Ideal for illustrating concepts related to financial analysis, economic trends, and technological advances in data handling. Can be used in presentations, corporate materials, or articles focusing on analytical breakthroughs and their applications in modern economy.
Powered by 


0
downloads
downloads
Tags:
More
Credit Photo
If you would like to credit the Photo, here are some ways you can do so
Text Link
photo Link
<span class="text-link">
<span>
<a target="_blank" href=https://pikwizard.com/photo/financial-data-analysis-with-digital-grid-overlay/88cfcd9dd943a588810788ae33479859/>PikWizard</a>
</span>
</span>
<span class="image-link">
<span
style="margin: 0 0 20px 0; display: inline-block; vertical-align: middle; width: 100%;"
>
<a
target="_blank"
href="https://pikwizard.com/photo/financial-data-analysis-with-digital-grid-overlay/88cfcd9dd943a588810788ae33479859/"
style="text-decoration: none; font-size: 10px; margin: 0;"
>
<img src="https://pikwizard.com/pw/medium/88cfcd9dd943a588810788ae33479859.jpg" style="margin: 0; width: 100%;" alt="" />
<p style="font-size: 12px; margin: 0;">PikWizard</p>
</a>
</span>
</span>
Free (free of charge)
Free for personal and commercial use.
Author: Creative Art
Similar Free Stock Images
Loading...

Premium


Premium


Premium


Premium


Premium


Premium


Premium


Premium


Premium


Premium


Premium


Premium


Premium


Premium


Premium


Premium


Premium


Premium


Premium


Premium


Premium


Premium


Premium


Premium

Premium
