
- Home >
- Stock Photos >
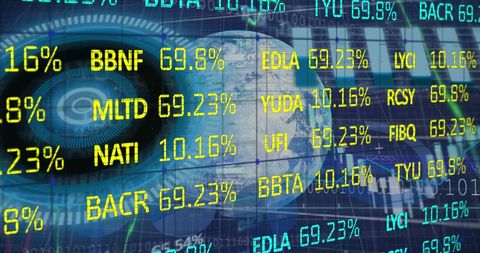
- Financial Data Analysis with Digital Interface Elements
Financial Data Analysis with Digital Interface Elements Image

Digital display of financial data statistics with a high technology interface. Useful for illustrating concepts of stock market analysis, banking, economic data, or presentations about business strategy and innovation. Could work well in materials focusing on finance technology, data security, or investment planning.
Powered by 


downloads
Tags:
More
Credit Photo
If you would like to credit the Photo, here are some ways you can do so
Text Link
photo Link
<span class="text-link">
<span>
<a target="_blank" href=https://pikwizard.com/photo/financial-data-analysis-with-digital-interface-elements/6347560d2bb55bc3f3ece2e0f06e52ca/>PikWizard</a>
</span>
</span>
<span class="image-link">
<span
style="margin: 0 0 20px 0; display: inline-block; vertical-align: middle; width: 100%;"
>
<a
target="_blank"
href="https://pikwizard.com/photo/financial-data-analysis-with-digital-interface-elements/6347560d2bb55bc3f3ece2e0f06e52ca/"
style="text-decoration: none; font-size: 10px; margin: 0;"
>
<img src="https://pikwizard.com/pw/medium/6347560d2bb55bc3f3ece2e0f06e52ca.jpg" style="margin: 0; width: 100%;" alt="" />
<p style="font-size: 12px; margin: 0;">PikWizard</p>
</a>
</span>
</span>
Free (free of charge)
Free for personal and commercial use.
Author: Creative Art
Similar Free Stock Images
Premium


Premium


Premium


Premium


Premium


Premium


Premium


Premium


Premium

Premium


Premium


Premium


Premium


Premium


Premium


Premium


Premium


Premium


Premium


Premium

Premium


Premium


Premium


Premium


Premium


Explore More Free Stock Images