
- Home >
- Stock Photos >
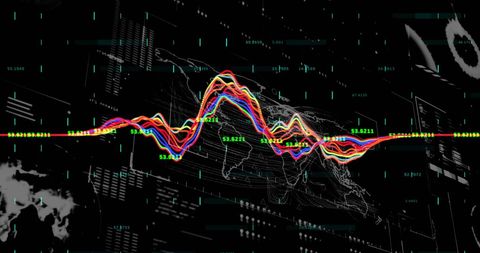
- Financial Data Analysis with Digital Network Connectivity
Financial Data Analysis with Digital Network Connectivity Image

Dynamic visualization showing processing of financial data through complex digital network connections on dark background. Vibrant, multicolored lines and digital numbers illustrate concepts of digital innovation, data analysis, and modern technology. Ideal for use in presentations, educational materials, or marketing content showcasing technological advancements in finance and data science.
Powered by 


downloads
Tags:
More
Credit Photo
If you would like to credit the Photo, here are some ways you can do so
Text Link
photo Link
<span class="text-link">
<span>
<a target="_blank" href=https://pikwizard.com/photo/financial-data-analysis-with-digital-network-connectivity/90d5935e949e9e339fc65eea1e38a6f3/>PikWizard</a>
</span>
</span>
<span class="image-link">
<span
style="margin: 0 0 20px 0; display: inline-block; vertical-align: middle; width: 100%;"
>
<a
target="_blank"
href="https://pikwizard.com/photo/financial-data-analysis-with-digital-network-connectivity/90d5935e949e9e339fc65eea1e38a6f3/"
style="text-decoration: none; font-size: 10px; margin: 0;"
>
<img src="https://pikwizard.com/pw/medium/90d5935e949e9e339fc65eea1e38a6f3.jpg" style="margin: 0; width: 100%;" alt="" />
<p style="font-size: 12px; margin: 0;">PikWizard</p>
</a>
</span>
</span>
Free (free of charge)
Free for personal and commercial use.
Author: Creative Art
Similar Free Stock Images

Premium


Premium

Premium


Premium

Premium


Premium


Premium


Premium


Premium


Premium


Premium

Premium


Premium


Premium


Premium


Premium


Premium


Premium

Premium


Premium


Premium

Premium


Premium


Premium


Premium


Explore More Free Stock Images