
- Home >
- Stock Photos >
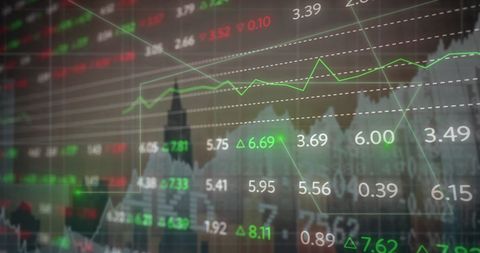
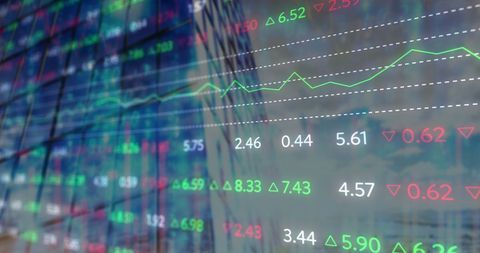
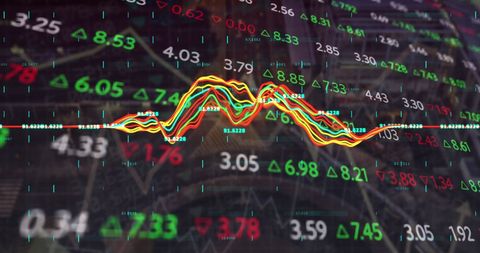
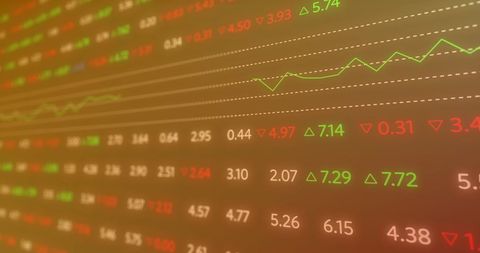
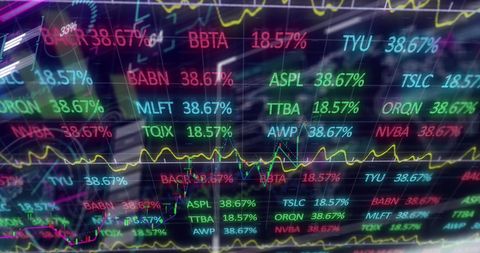
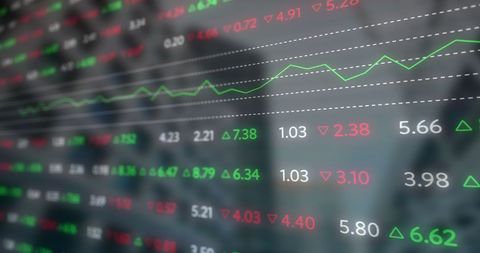
- Financial Data Analysis with Digital Trading Graphics
Financial Data Analysis with Digital Trading Graphics Image

Digital glow lines pulse across a screen filled with rapid statistics and financial data, evoking a high-pressure stock market environment. Suitable for illustrating concepts in global finance, digital trading, economic data exchange, financial analysis reports, or business investment development strategies.
Powered by 


downloads
Tags:
More
Credit Photo
If you would like to credit the Photo, here are some ways you can do so
Text Link
photo Link
<span class="text-link">
<span>
<a target="_blank" href=https://pikwizard.com/photo/financial-data-analysis-with-digital-trading-graphics/7c86969db68ef17923b992e27247fa8d/>PikWizard</a>
</span>
</span>
<span class="image-link">
<span
style="margin: 0 0 20px 0; display: inline-block; vertical-align: middle; width: 100%;"
>
<a
target="_blank"
href="https://pikwizard.com/photo/financial-data-analysis-with-digital-trading-graphics/7c86969db68ef17923b992e27247fa8d/"
style="text-decoration: none; font-size: 10px; margin: 0;"
>
<img src="https://pikwizard.com/pw/medium/7c86969db68ef17923b992e27247fa8d.jpg" style="margin: 0; width: 100%;" alt="" />
<p style="font-size: 12px; margin: 0;">PikWizard</p>
</a>
</span>
</span>
Free (free of charge)
Free for personal and commercial use.
Author: Authentic Images
Similar Free Stock Images

Premium


Premium


Premium


Premium


Premium


Premium


Premium


Premium

Premium

Premium


Premium


Premium


Premium

Premium


Premium


Premium


Premium


Premium

Premium


Premium

Premium


Premium


Premium

Premium


Premium


Explore More Free Stock Images