- Home >
- Stock Photos >
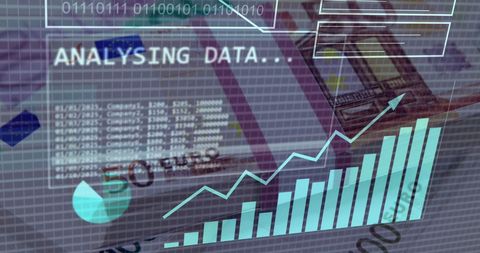
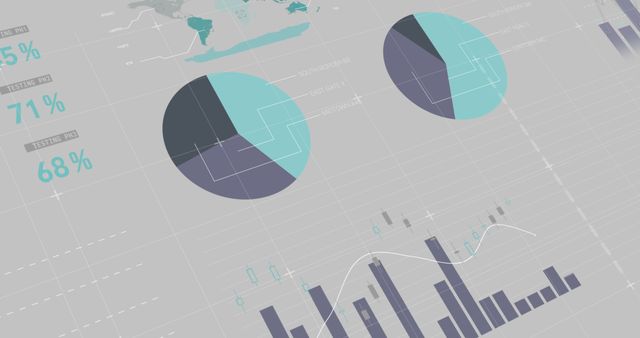
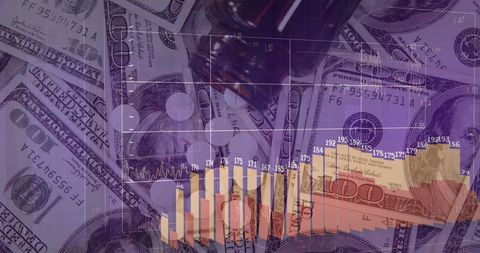
- Financial Data Analysis with Dollar Bills Background
Financial Data Analysis with Dollar Bills Background Image

Graphs and data charts are visually represented over a pile of dollar bills, showcasing relation between data analytics and economics. Ideal for illustrating themes of financial growth, global business dynamics, data processing in fintech, or conducting efficacy studies in corporate finances.

downloads
Tags:
More
Credit Photo
If you would like to credit the Photo, here are some ways you can do so
Text Link
photo Link
<span class="text-link">
<span>
<a target="_blank" href=https://pikwizard.com/photo/financial-data-analysis-with-dollar-bills-background/590b3d0b3c0846368b85d273b5fb25be/>PikWizard</a>
</span>
</span>
<span class="image-link">
<span
style="margin: 0 0 20px 0; display: inline-block; vertical-align: middle; width: 100%;"
>
<a
target="_blank"
href="https://pikwizard.com/photo/financial-data-analysis-with-dollar-bills-background/590b3d0b3c0846368b85d273b5fb25be/"
style="text-decoration: none; font-size: 10px; margin: 0;"
>
<img src="https://pikwizard.com/pw/medium/590b3d0b3c0846368b85d273b5fb25be.jpg" style="margin: 0; width: 100%;" alt="" />
<p style="font-size: 12px; margin: 0;">PikWizard</p>
</a>
</span>
</span>
Free (free of charge)
Free for personal and commercial use.
Author: Creative Art