- Home >
- Stock Photos >
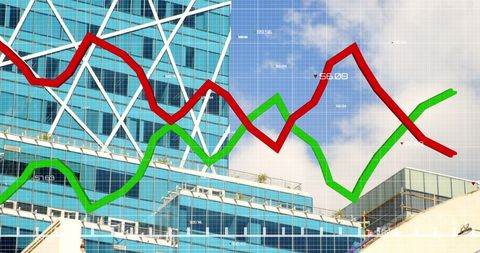
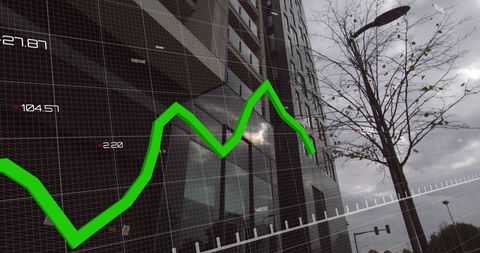
- Financial Data Analysis with Downward Graph Overlay
Financial Data Analysis with Downward Graph Overlay Image

Features a stylized representation of financial data analysis with a prominent downward-going graph overlaid on grids and a road. This image suggests themes of financial analysis, economic fluctuations, and technological integration in global markets. Useful for illustrations in business reports, financial market articles, or presentations on current economic conditions and data processing trends.

downloads
Tags:
More
Credit Photo
If you would like to credit the Photo, here are some ways you can do so
Text Link
photo Link
<span class="text-link">
<span>
<a target="_blank" href=https://pikwizard.com/photo/financial-data-analysis-with-downward-graph-overlay/8196dcfa42c327c1f9acf1f430b376a0/>PikWizard</a>
</span>
</span>
<span class="image-link">
<span
style="margin: 0 0 20px 0; display: inline-block; vertical-align: middle; width: 100%;"
>
<a
target="_blank"
href="https://pikwizard.com/photo/financial-data-analysis-with-downward-graph-overlay/8196dcfa42c327c1f9acf1f430b376a0/"
style="text-decoration: none; font-size: 10px; margin: 0;"
>
<img src="https://pikwizard.com/pw/medium/8196dcfa42c327c1f9acf1f430b376a0.jpg" style="margin: 0; width: 100%;" alt="" />
<p style="font-size: 12px; margin: 0;">PikWizard</p>
</a>
</span>
</span>
Free (free of charge)
Free for personal and commercial use.
Author: Authentic Images