- Home >
- Stock Photos >
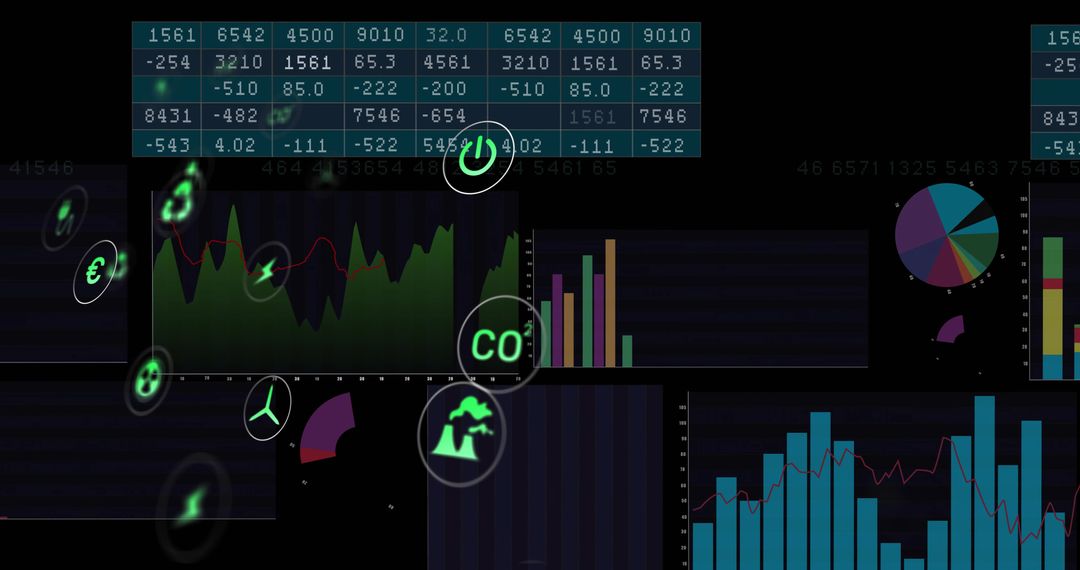
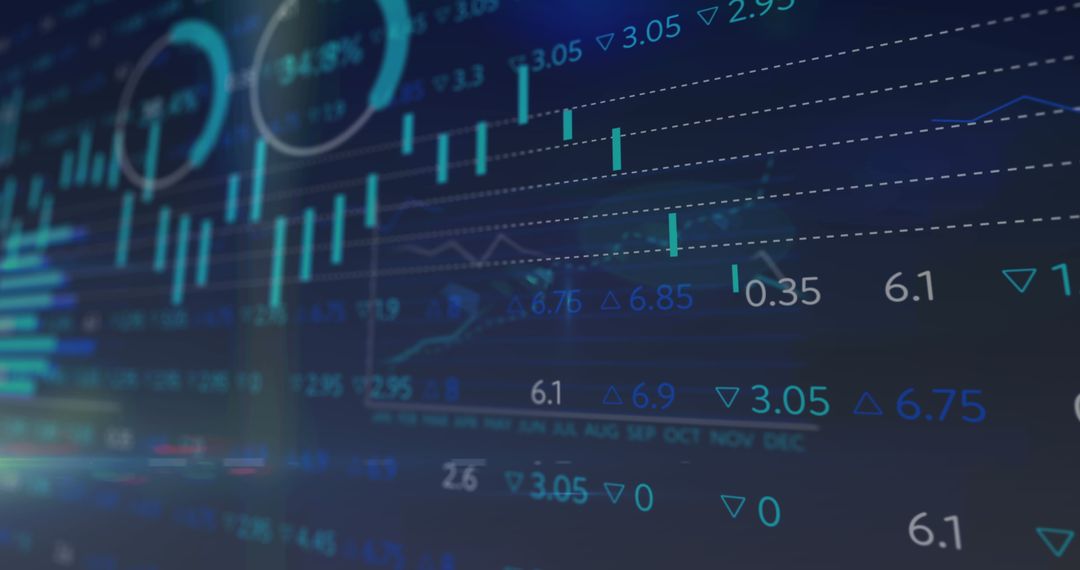
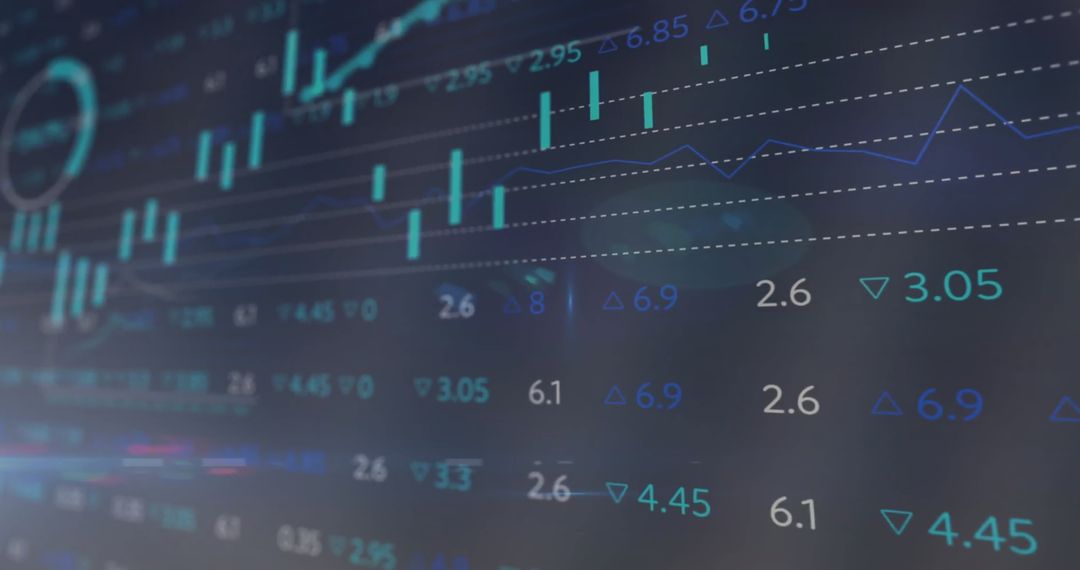
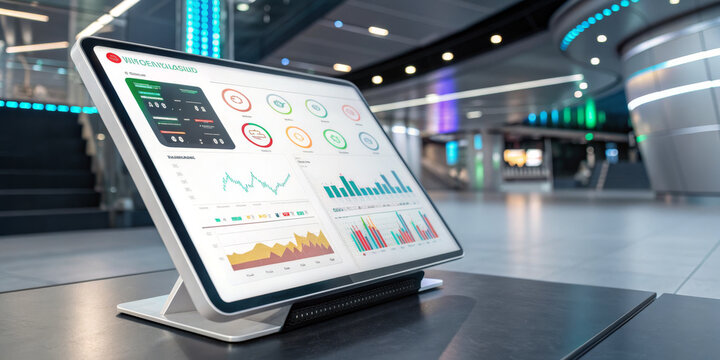
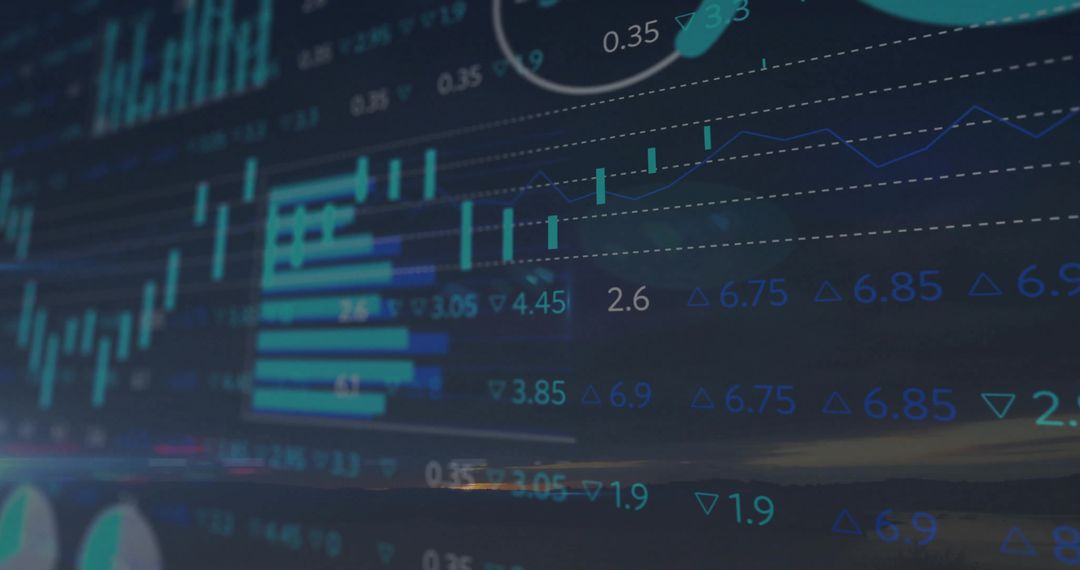
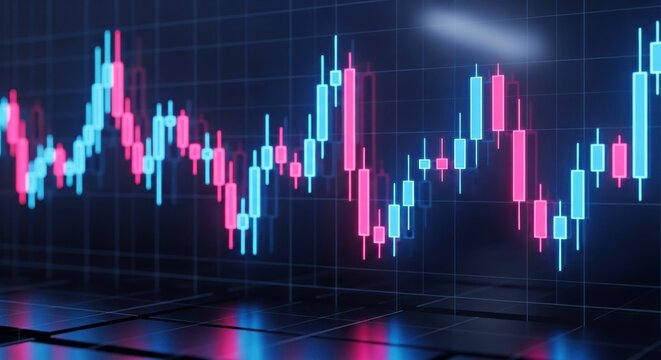
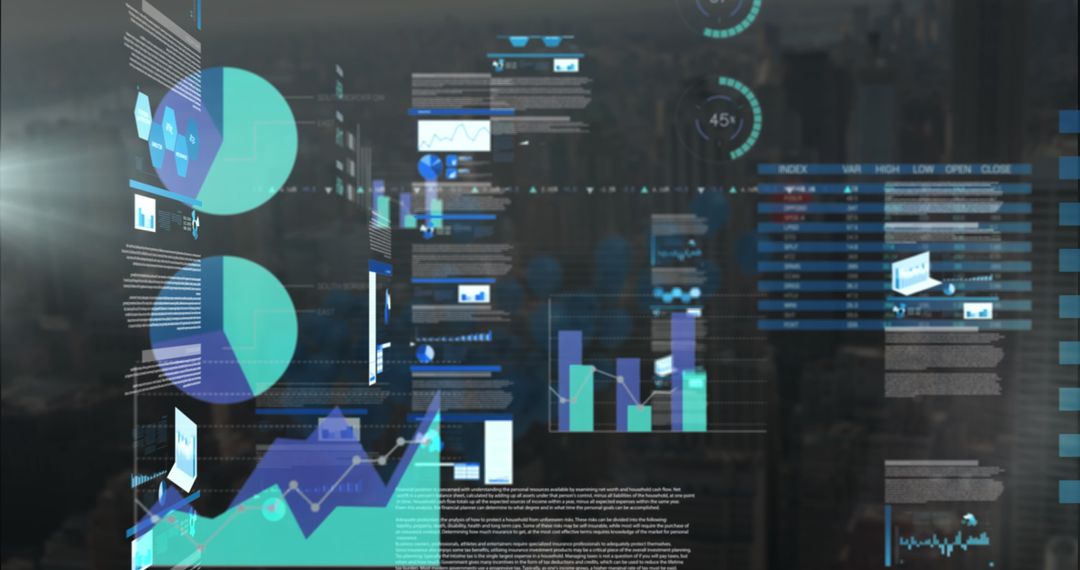
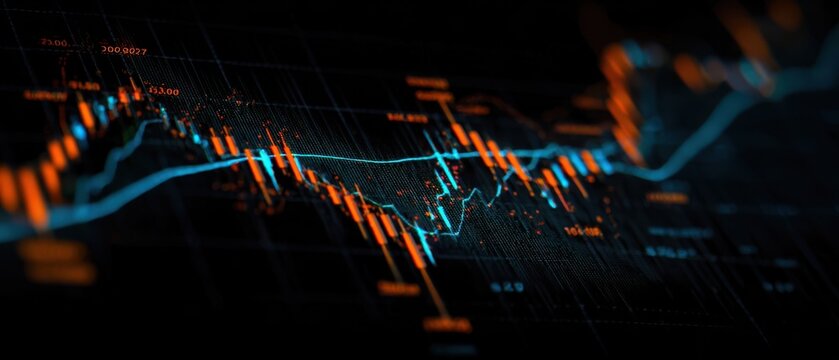
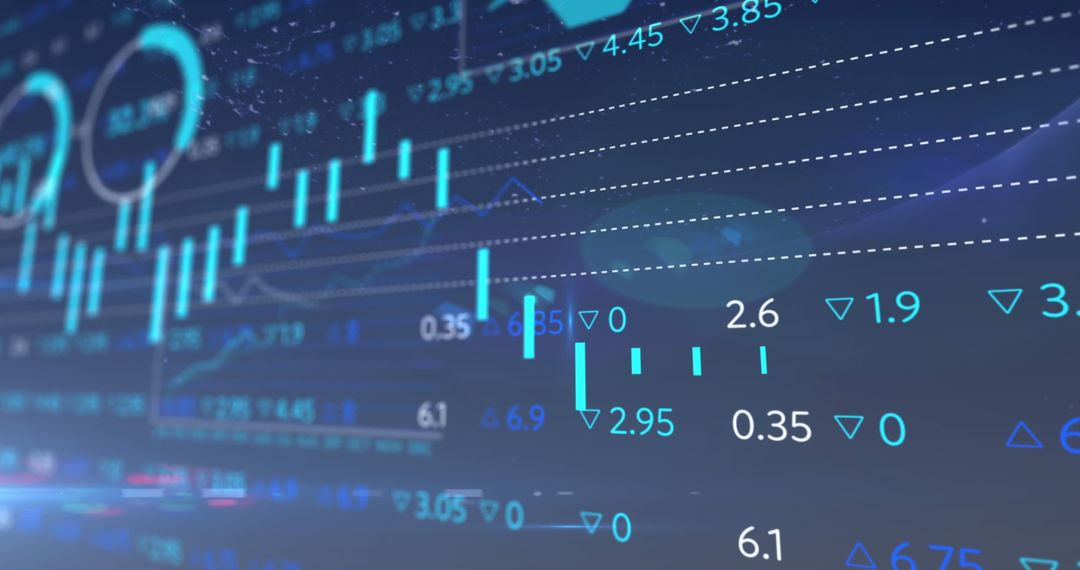
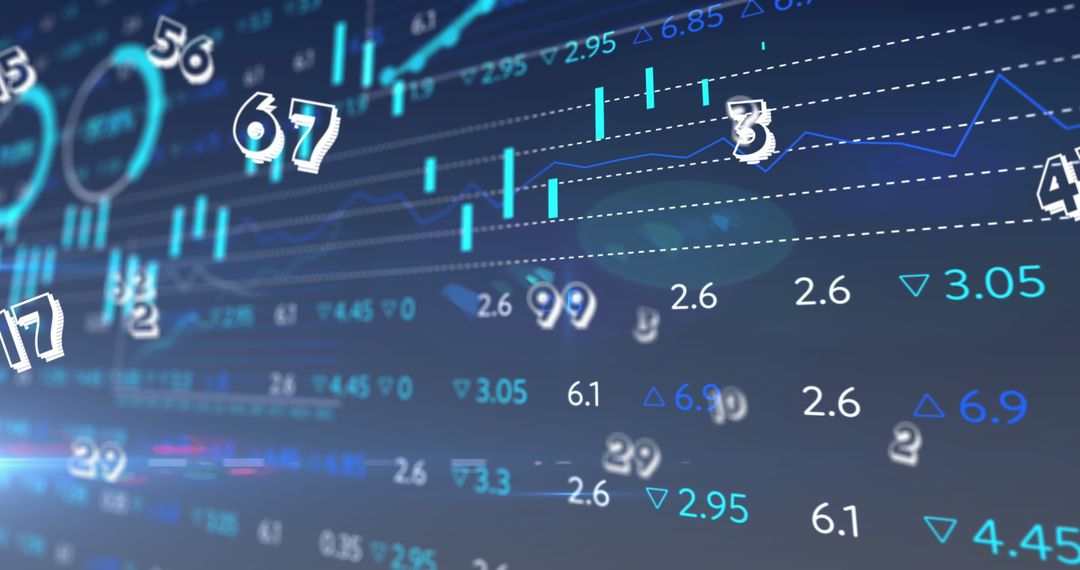
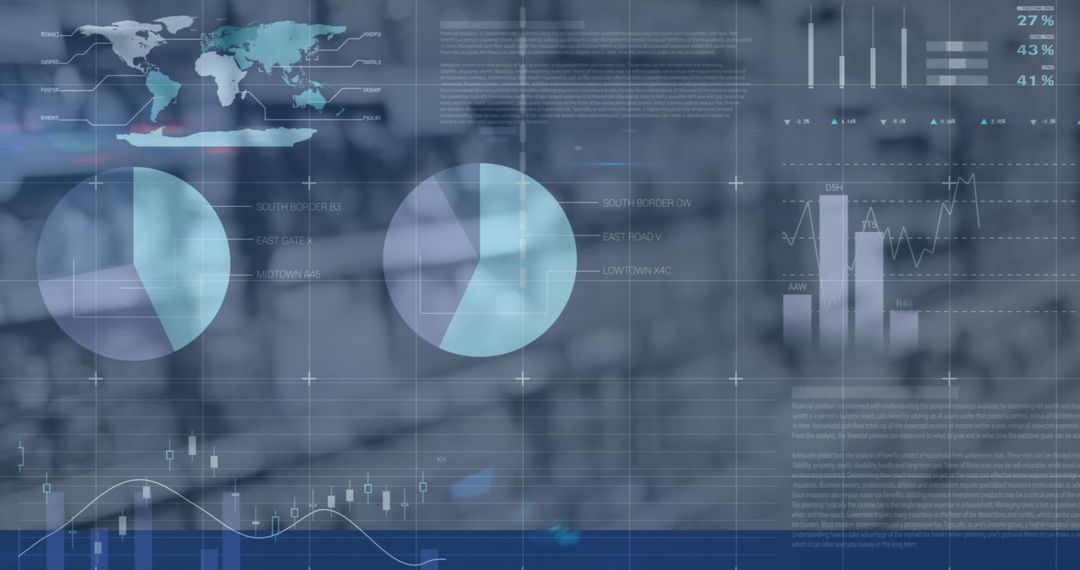
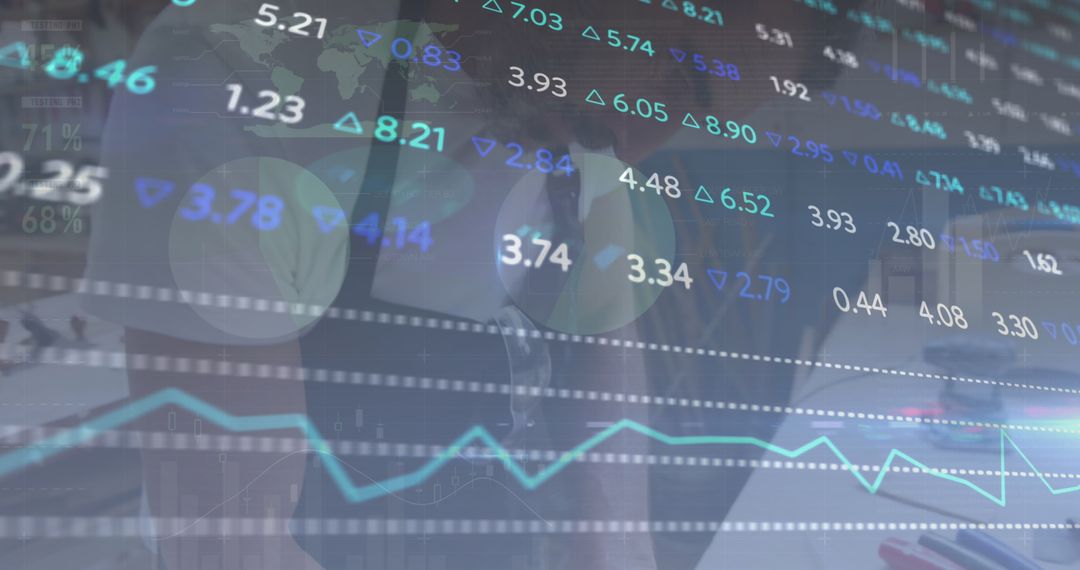
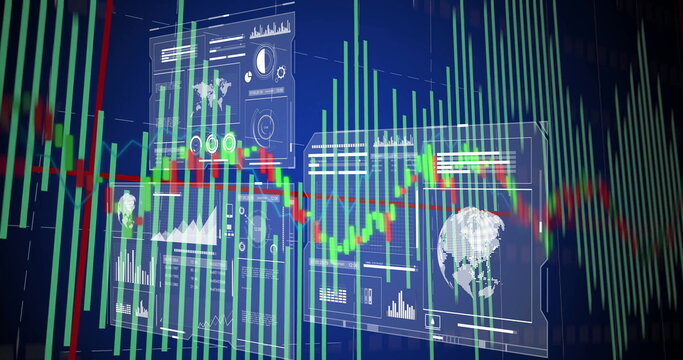
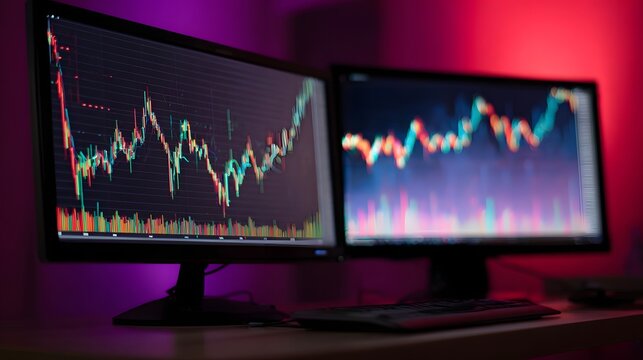
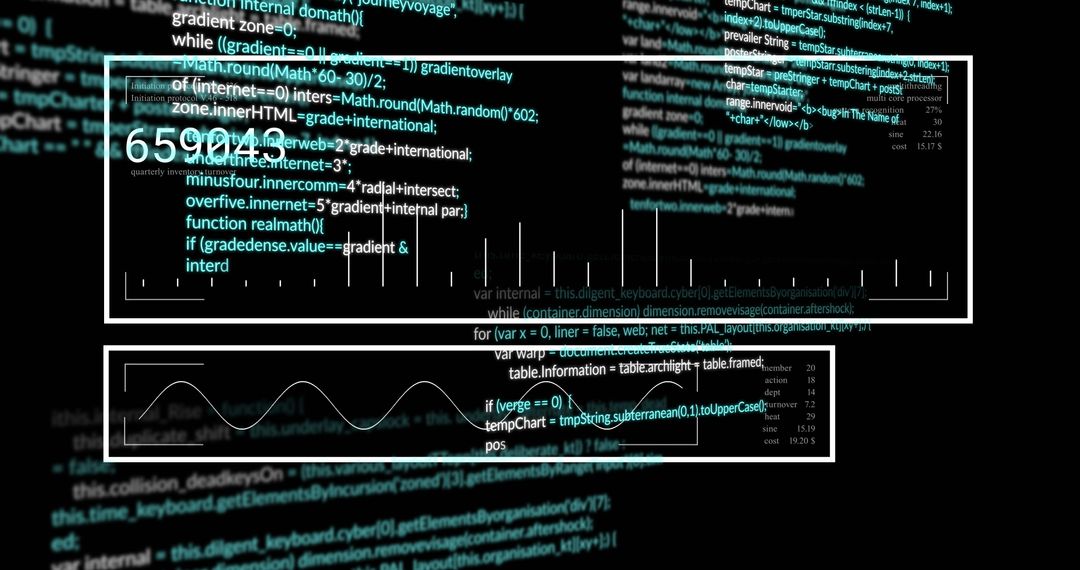
- Financial Data Analysis with Dynamic Trading Dashboard and Charts
Financial Data Analysis with Dynamic Trading Dashboard and Charts Image
Visual representing financial data analysis displayed through a modern trading dashboard engagingly. Features candlestick charts and real-time numerical data labels. Ideal for use in financial articles, investment platforms, or blogs focusing on stock market trends and data visualization solutions.
Powered by 


0
downloads
downloads
Tags:
More
Credit Photo
If you would like to credit the Photo, here are some ways you can do so
Text Link
photo Link
<span class="text-link">
<span>
<a target="_blank" href=https://pikwizard.com/photo/financial-data-analysis-with-dynamic-trading-dashboard-and-charts/a12658783dde4051cbcaee54463b04e5/>PikWizard</a>
</span>
</span>
<span class="image-link">
<span
style="margin: 0 0 20px 0; display: inline-block; vertical-align: middle; width: 100%;"
>
<a
target="_blank"
href="https://pikwizard.com/photo/financial-data-analysis-with-dynamic-trading-dashboard-and-charts/a12658783dde4051cbcaee54463b04e5/"
style="text-decoration: none; font-size: 10px; margin: 0;"
>
<img src="https://pikwizard.com/pw/medium/a12658783dde4051cbcaee54463b04e5.jpg" style="margin: 0; width: 100%;" alt="" />
<p style="font-size: 12px; margin: 0;">PikWizard</p>
</a>
</span>
</span>
Free (free of charge)
Free for personal and commercial use.
Author: Authentic Images
Similar Free Stock Images
Premium


Premium


Premium


Premium


Premium


Premium


Premium


Premium
Premium
![[The tablet displaying colorful financial candlestick charts and market data in soft bokeh]](https://t4.ftcdn.net/jpg/16/69/72/09/360_F_1669720911_0WX7fuSNVdvc3W4FHVnAjOhcruAw0KWz.jpg)


Premium


Premium


Premium


Premium


Premium


Premium


Premium


Premium


Premium


Premium


Premium


Premium


Premium


Premium


Premium