
- Home >
- Stock Photos >
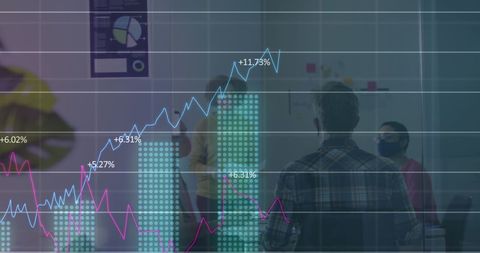
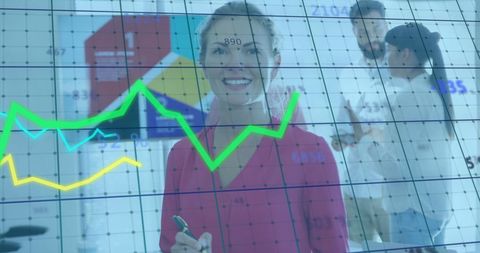
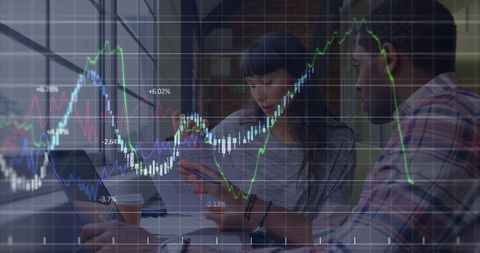
- Financial Data Analysis with Futuristic Interface
Financial Data Analysis with Futuristic Interface Image

This image depicts a leader analyzing financial data with a futuristic digital interface, conveying themes of technology and business innovation. The visual of data graphs suggests growth and strategic planning, making it ideal for illustrating concepts related to corporate finance, technological advancement, or business strategy presentations.
Powered by 


downloads
Tags:
More
Credit Photo
If you would like to credit the Photo, here are some ways you can do so
Text Link
photo Link
<span class="text-link">
<span>
<a target="_blank" href=https://pikwizard.com/photo/financial-data-analysis-with-futuristic-interface/2b7774780ed319d7ab9bbe8979b64cac/>PikWizard</a>
</span>
</span>
<span class="image-link">
<span
style="margin: 0 0 20px 0; display: inline-block; vertical-align: middle; width: 100%;"
>
<a
target="_blank"
href="https://pikwizard.com/photo/financial-data-analysis-with-futuristic-interface/2b7774780ed319d7ab9bbe8979b64cac/"
style="text-decoration: none; font-size: 10px; margin: 0;"
>
<img src="https://pikwizard.com/pw/medium/2b7774780ed319d7ab9bbe8979b64cac.jpg" style="margin: 0; width: 100%;" alt="" />
<p style="font-size: 12px; margin: 0;">PikWizard</p>
</a>
</span>
</span>
Free (free of charge)
Free for personal and commercial use.
Author: Awesome Content
Similar Free Stock Images

Premium


Premium


Premium


Premium


Premium


Premium


Premium

Premium


Premium


Premium


Premium


Premium


Premium


Premium

Premium


Premium


Premium

Premium


Premium


Premium


Premium


Premium


Premium


Premium


Premium

Explore More Free Stock Images