- Home >
- Stock Photos >
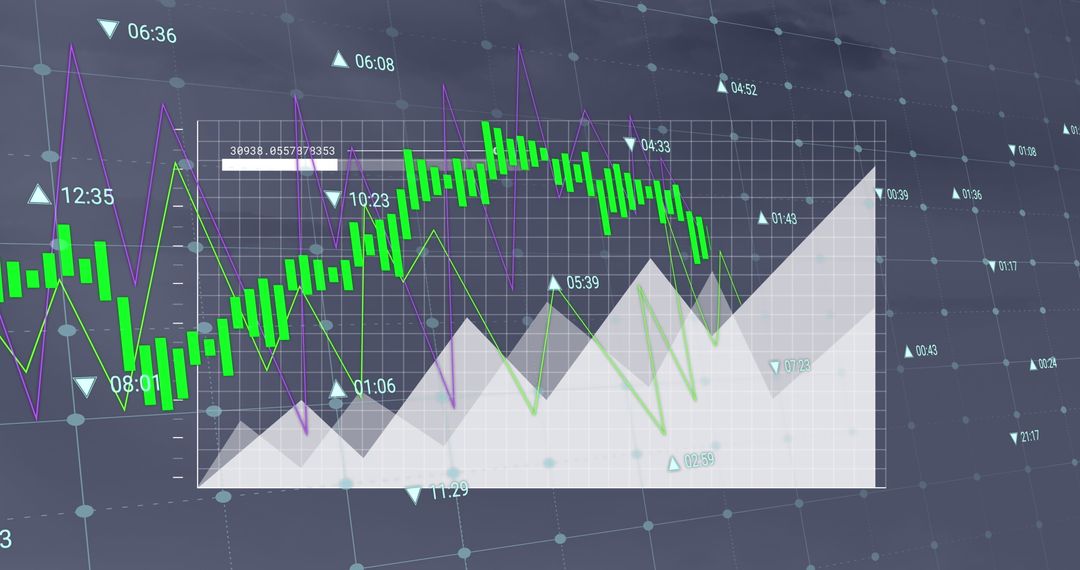
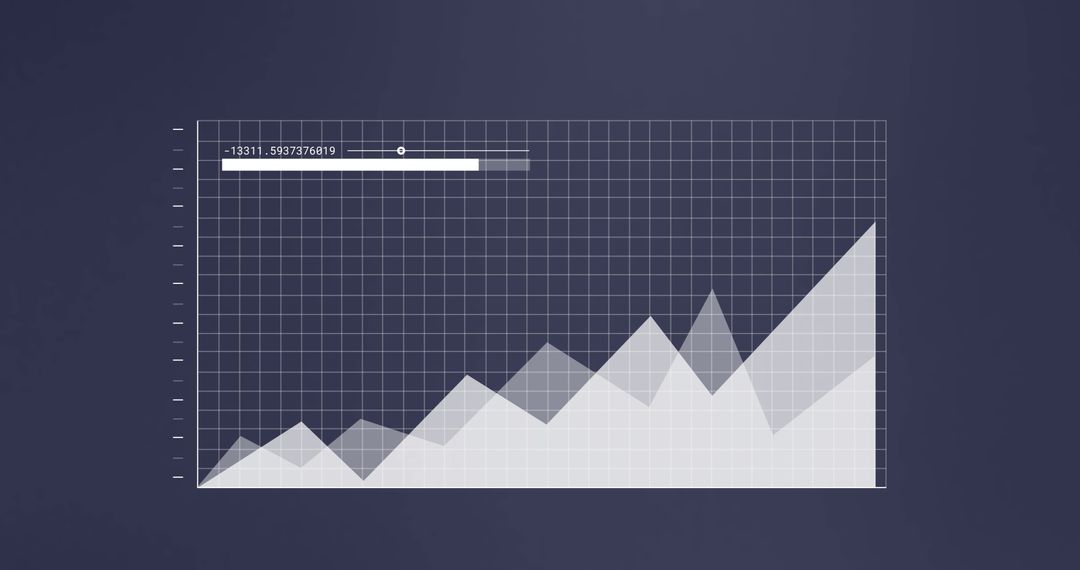
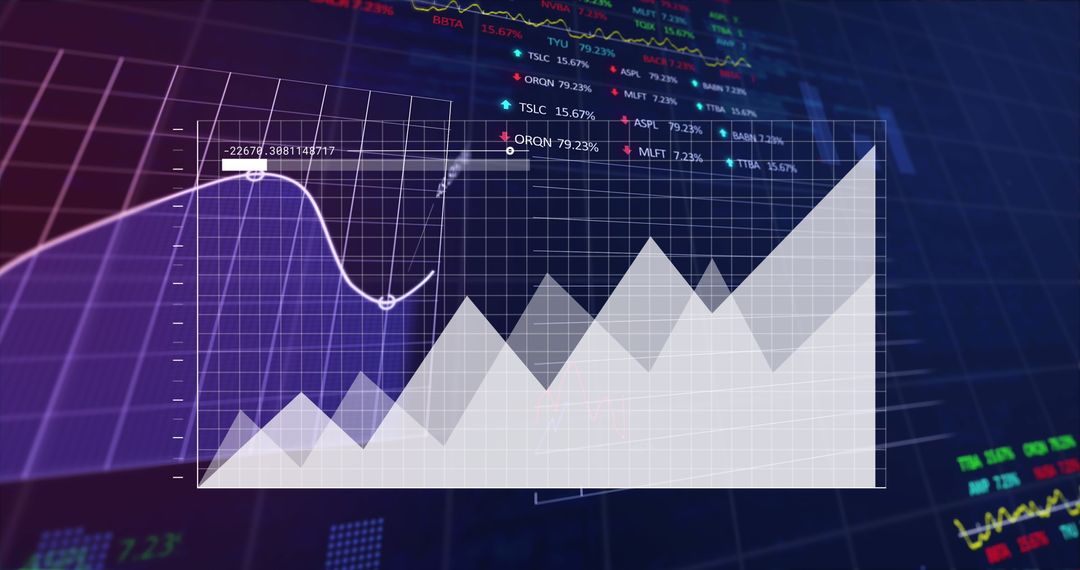
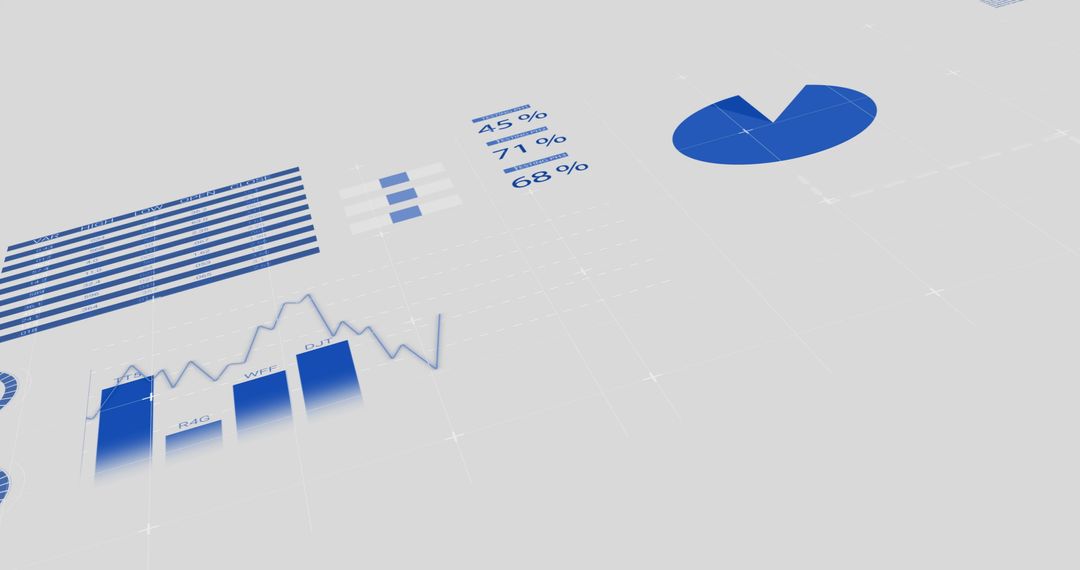
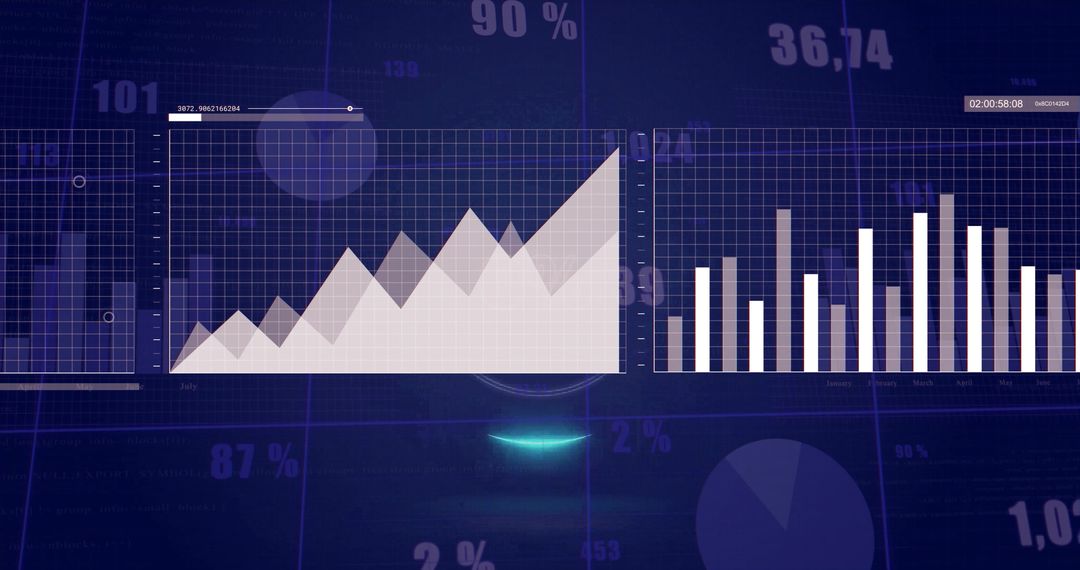
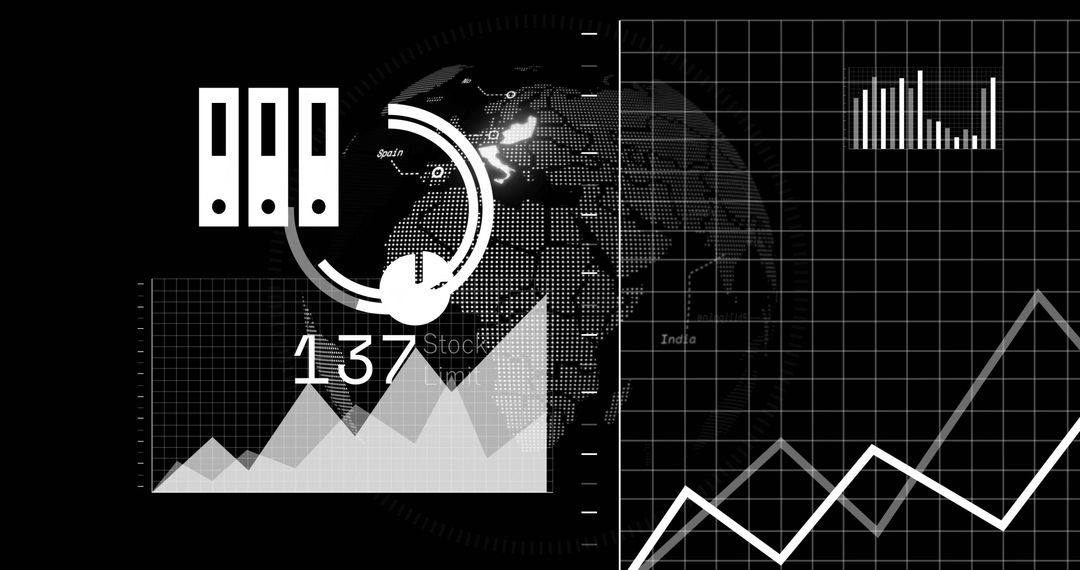
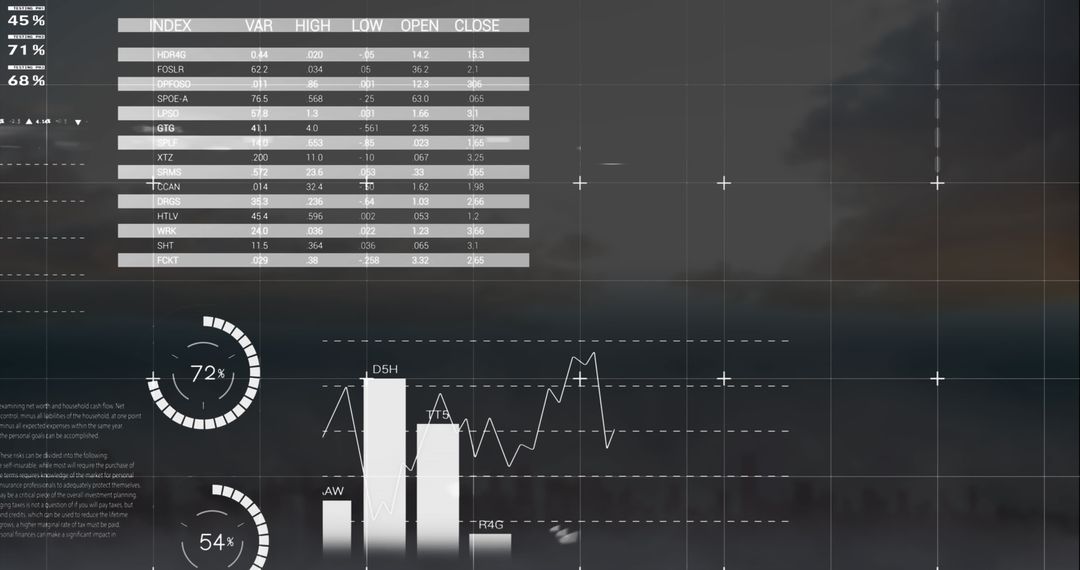
- Financial Data Analysis with Global Connectivity Theme
Financial Data Analysis with Global Connectivity Theme Image

This visualization illustrates the concept of financial data analysis and global connectivity, featuring graphical data overlays on a digital map. It's ideal for presentations about global business strategies, data-driven decision making, or economic trends. Useful in marketing materials for tech or finance industries showcasing connectivity innovation or financial analysis solutions.
Powered by 


0
downloads
downloads
Tags:
More
Credit Photo
If you would like to credit the Photo, here are some ways you can do so
Text Link
photo Link
<span class="text-link">
<span>
<a target="_blank" href=https://pikwizard.com/photo/financial-data-analysis-with-global-connectivity-theme/6cd9ccecd1540e92f63e96187bb2924b/>PikWizard</a>
</span>
</span>
<span class="image-link">
<span
style="margin: 0 0 20px 0; display: inline-block; vertical-align: middle; width: 100%;"
>
<a
target="_blank"
href="https://pikwizard.com/photo/financial-data-analysis-with-global-connectivity-theme/6cd9ccecd1540e92f63e96187bb2924b/"
style="text-decoration: none; font-size: 10px; margin: 0;"
>
<img src="https://pikwizard.com/pw/medium/6cd9ccecd1540e92f63e96187bb2924b.jpg" style="margin: 0; width: 100%;" alt="" />
<p style="font-size: 12px; margin: 0;">PikWizard</p>
</a>
</span>
</span>
Free (free of charge)
Free for personal and commercial use.
Author: Creative Art
Similar Free Stock Images
Premium


Premium


Premium


Premium


Premium


Premium


Premium


Premium


Premium


Premium


Premium


Premium


Premium


Premium


Premium


Premium


Premium


Premium


Premium


Premium


Premium


Premium


Premium


Premium