
- Home >
- Stock Photos >
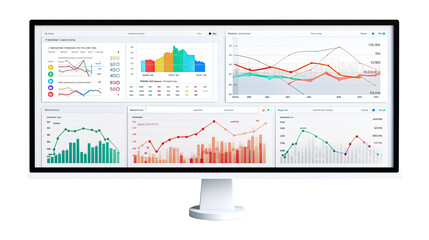
- Financial Data Analysis with Global Maps and Charts Visualization
Financial Data Analysis with Global Maps and Charts Visualization Image

This image features a complex layout of financial charts, graphs, and world maps indicating data analysis and global economic trends. Ideal for illustrating financial reports, economic forecasts, and market analysis presentations. Suitable for use in articles and websites related to finance, investment, technology, and global business strategies.
Powered by 


downloads
Tags:
More
Credit Photo
If you would like to credit the Photo, here are some ways you can do so
Text Link
photo Link
<span class="text-link">
<span>
<a target="_blank" href=https://pikwizard.com/photo/financial-data-analysis-with-global-maps-and-charts-visualization/d43df10750d4cb2087d2b809b1eadb36/>PikWizard</a>
</span>
</span>
<span class="image-link">
<span
style="margin: 0 0 20px 0; display: inline-block; vertical-align: middle; width: 100%;"
>
<a
target="_blank"
href="https://pikwizard.com/photo/financial-data-analysis-with-global-maps-and-charts-visualization/d43df10750d4cb2087d2b809b1eadb36/"
style="text-decoration: none; font-size: 10px; margin: 0;"
>
<img src="https://pikwizard.com/pw/medium/d43df10750d4cb2087d2b809b1eadb36.jpg" style="margin: 0; width: 100%;" alt="" />
<p style="font-size: 12px; margin: 0;">PikWizard</p>
</a>
</span>
</span>
Free (free of charge)
Free for personal and commercial use.
Author: People Creations
Similar Free Stock Images

Premium


Premium


Premium


Premium


Premium


Premium


Premium


Premium


Premium


Premium


Premium


Premium


Premium


Premium


Premium


Premium


Premium


Premium


Premium


Premium

Premium


Premium


Premium


Premium


Premium


Explore More Free Stock Images