1. Home > 
  2. Stock Photos > 
  3. Financial Data Analysis with Global Market Interface

Financial Data Analysis with Global Market Interface Image

Financial Data Analysis with Global Market Interface

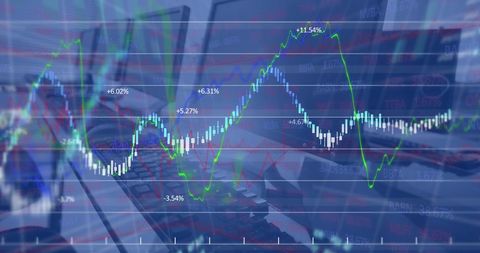
Visualizing complex financial data with graphs overlaid on a dimly lit office setting features investment and tech trends. Ideal for businesses focusing on financial analysis, presentations, investment opportunities, economic evaluations, or business propositions.

Powered by Adobe logo
Forex colorful diagrams and stock market data with lines and dynamics - Powered by AdobeWidescreen Abstract financial graph with uptrend line and bar chart of stock market on blue color background - Powered by AdobeYoung professional woman analyzing stock market data with tablet - Powered by AdobePerspective view of stock market growth, business investing and data concept with digital financial chart graphs, diagrams and indicators on dark blue blurry background. 3D rendering - Powered by AdobeLaptop screen displaying financial charts - Powered by Adobe

Credit Photo

If you would like to credit the Photo, here are some ways you can do so

Free (free of charge)

Free for personal and commercial use.

Author: Authentic Images

Similar Free Stock Images

Dynamic Financial Growth Representing Business Trends
Premium
Night cityscape backdrop with dynamic stock market graph overlaid
Global Financial Data Trends on Digital World Map Display
Colleagues Analyzing Data with Digital Graph Overlay
Premium
Red and yellow financial graph descending against blue background with bokeh lights stock market trading
Financial Growth Chart Overlay on City Skyline
Team Analyzing Data on Desktop Monitors with Green Line Chart Overlay in Open Office
Business Team Analyzing Financial Growth Charts in Modern Office
Premium
Financial advisor explaining invest stock market data consulting investor. Two busy business men analysts doing finance trading analysis pointing at exchange chart on laptop screen working in office.
Premium
Financial growth chart for stock market investment trading.
Dynamic Financial Market Graph Amidst Digital Equations
Business Professionals Analyzing Stock Trends with Digital Financial Charts
Financial Data Overlay on Cityscape Visualizing Market Trends
Diverse Female Colleagues Analyzing Financial Data
Financial Dashboard with Line and Bar Graphs for Market Analysis
Abstract Financial Data Analysis and Global Business Concept
Red Line Graph on Digital Grid Background for Analytics
Premium
Abstract glowing big data forex candlestick chart on blurry city backdrop. Trade, technology, investment and analysis concept
Premium
female hand holding smartphone, business style, stocks and exchanges, professional photo
Financial Data Analysis with Declining Trends
Financial Stock Market Data Visualization with Declining Trends
Data Trends and Analysis on 3D Digital Grid
Financial Data with Molecular Background Concept
Premium
Financial data charts with glowing stock and forex graphs on a dark background illuminated in blue tones. 3D Rendering
European Market Data Overlay with EU Flag and Financial Graphs
Analyzing Financial Data with Business Charts Against Urban Skyline
Digital Trading Interface with Red Fluctuating Line Graph
Financial Data Charts in Shimmering Blue Digital Space
Financial Data Analysis in Modern Server Room Environment
Financial Data Analysis with Global Digital Interface
Business Team Analyzing Market Graphs in Digital Interface
Financial Data Processing in Modern Office Environment
Financial Growth Statistic Data Processing Over Urban Cityscape
Financial Analysis Dashboard Overlay on Modern Office Workspace
Dynamic Stock Market Chart with Fluctuating Trends and Data Points
Neon Candlestick Chart on Grid with Data Analytics Theme
Futuristic Digital Interface with Dynamic Financial Graph
Premium
stock market visual metaphor concept. A crystal ball displaying financial graph trends on a dark cushion.
Premium
Green arrow pointing upward on financial graph. Business growth chart with rising trend line. Digital stock market data visualization for investment analysis
Businesswomen Analyzing Financial Graphs for Growth Opportunities
Digital Interface Display Over Urban Skyline for Financial Analytics
Dynamic Stock Market Graph Displaying Surging Growth
Dynamic Financial Data Graphs with Holographic Styles
Financial Data Processing in Server Room with Chart Overlay
Digital Financial Data Overlaid on Modern Office Background
Graphical Stock Data Overlapped on Urban Architecture
Digital Financial Data Visualization with Graph and Metrics
Professional Team Analyzing Data Graphs in Modern Boardroom
Abstract Virtual Finance Data Overlay on Cityscape
Dynamic Financial Data Displays Stock Market Trends
Analyzing Data Graph on Laptop with Tools at Modern Workspace
Dynamic Financial Data Visualizations on Grid Interface
Financial Data Visualization Over Futuristic Cityscape
Premium
Close-up view of a financial data chart showing market analytics and stock trading trends with a blurred background.
Financial Data Analysis with Stock Market Trends
Diverse Team Analyzing Business Market Trends with Technology
Colleagues Analyzing Data with Graph Overlay in Office
Financial Data Flow against Urban Skyline Backdrop
Premium
Representation of data analytics,charts, graphs and data driven insights emerging from a sea of information
Premium
Business, people or meeting with laptop in office for trading update, stock price interest or planning. Trader, team and pointing to tech for market research, financial news and monitoring portfolio
Analyzing Financial Data in a Business Technology Office
Rising Trend on Digital Financial Analytics Screen
Financial Data Processing Over Computer Servers
Multiseries Financial Market Chart Showing Rising Green Trend Candlesticks and Percent Labels
Premium

Dynamic blue and green digital stock market graph with bar charts and lines on a dark background, representing financial data analysis, investment trends, business growth, and global economy fluctuat
Premium
Business people, stock market and night with computer for profit, financial growth or increase at office. Businessman, woman or brokers with tech screen or display for online trading or investment
Asian Man Analyzing Financial Data Graphs in Server Room
Financial Graphs Overlaying Shopping Bag Representation Economy
Data Visualization on Digital Interface with Graphs and Codes
Digital Financial Data Analysis with Globe and Laptop
Dynamic Stock Market Visual in Modern Office Setting
Financial Data and Stock Market Analysis on Digital Screen
Diverse Team Collaborating with Data and Analytics
Business Colleagues Discussing Market Trends in Modern Office
Premium
Hand interacting with financial stock market trading candlestick charts analyzing growth opportunities and investment strategies
Premium
Business financial chart with moving up arrow graph.Financial data charts with glowing stock market graphs.Stock market investment data and analysis finance graph.
Premium
Close-up of a digital screen displaying financial stock market data with graphs and analytics, illustrating market trends and investment analysis.
Digital Data Analytics Overlay on Cityscape
City Skyline with Overlay of Financial Market Trends
Caucasian Woman Leading Financial Data Analysis in Modern Office
Server Network Analytics with Data Visualization Overlay
Premium
Close up of a magnifying glass analyzing financial candlestick charts and stock market trends
Digital Financial Data Trends and Analytics Conceptual Background
Dynamic Financial Data Display in Digital Space
Senior Businessman Discussing Financial Growth Trends
Presenter Pointing at Flip Chart While Team Brainstorming with Data Charts in Modern Office
Premium
AI finance business data analysis digital technology investment trading market stock, financial analyst using advanced holographic interface for global market insight, smart investment strategy
Digital Financial Data Overlaying City Skyline at Dusk
Dynamic Global Market Trends Over World Map Visualization
Trend Analysis with Candlestick Chart and Data Indicators
Futuristic Stock Market Graph With Digital Overlay
Premium
Businessman working late analyzing financial data stock market charts in modern office setting
Networking Graph Overlay Data Server Room Visualization
Futuristic Data Dashboard with Abstract Waveforms and Light Effects
Financial Data Displayed Over City Skyline with Rising Graphs
Engineers Analyzing Financial Data in Server Room
Dynamic Forex Trading Graphs with Increasing Numbers
Diverse Businesswomen Analyzing Financial Graphs in Modern Office
Dynamic Financial Data and Stock Market Charts
Financial Growth Chart Over Ocean with Green Grid Overlay
Digital Data Trends Over High-Tech Server Room
Financial Trends Overlaid on Office Desks with Data Points
Analytics Graph Overlay on Modern Data Center
Financial Growth Data Overlay on Urban Skyline
Premium
Dynamic glowing green stock market graph ascends, symbolizing financial growth and positive economic trends with bokeh lights.
Bitcoin Symbol with Financial Data Dynamic Representation
Middle Eastern Architect Reviews Blueprints with Data Visualization
Dynamic Financial Data with Overlaid Cityscape Interface
Futuristic Digital Data Analytics Interface Display
Premium
Finance trade manager analyzing stock market indicators for best investment strategy, financial data and charts, digital ai
Financial Data Analysis and Technological Interface at Office
Senior Manager Analyzing Financial Trends on Glass Wall
Digital Light Trails Over Data Processing on Blue Background
Dynamic Glowing Digital Graphs on 3D Grid Background
Premium
financial chart with stock market graph and silhouette people walking in office with cityscape blurred background
Dynamic Stock Market Chart Displaying Fluctuating Trends and Growth Percentages
Professional Analyzing Data on Laptop with Graph Overlay
Dynamic Financial Graphs Overlaying Urban Skyline
Dynamic Business Team Analyzing Data with Trend Graph Overlay
Premium
Businessman and broker analyzing profit of investment and stock market growth performance forecast and financial growth of business, Investor and stock exchange trading.
Abstract Financial Data Visualization in Server Room
Colleagues Analyzing Digital Financial Data Graph Overlay
Overlay of Financial Data on Business People in Office Building
Financial Data Analytics in High-Tech Server Room
Premium
Graphs and world financial markets data. Investor pointing at the candlestick chart.
Explore More Free Stock Images