- Home >
- Stock Photos >
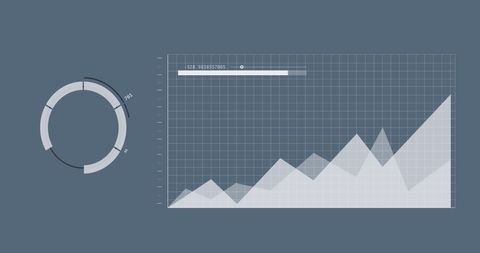
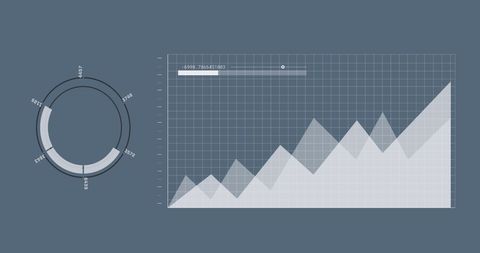
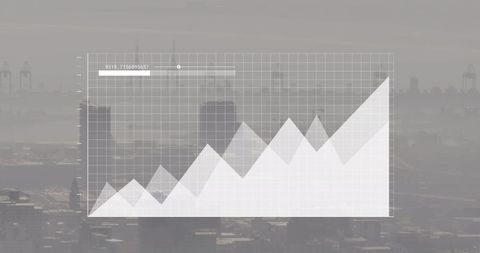
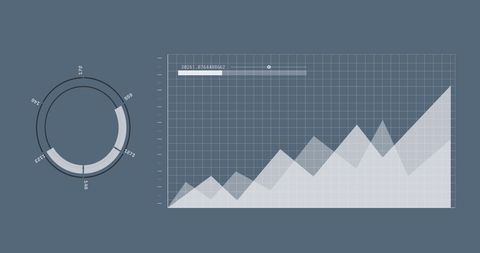
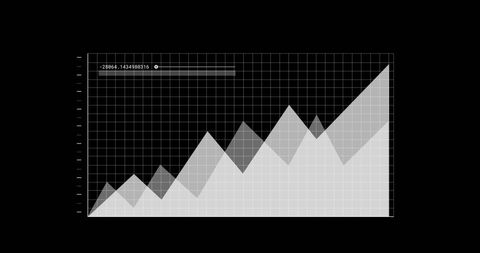
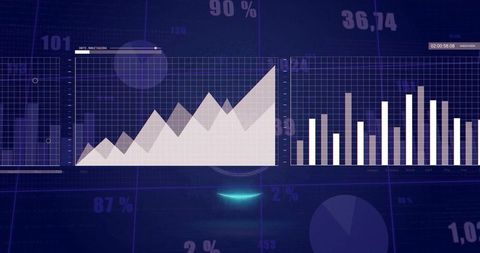
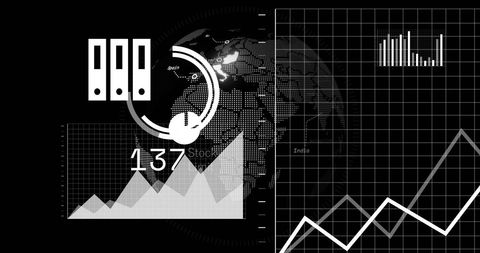
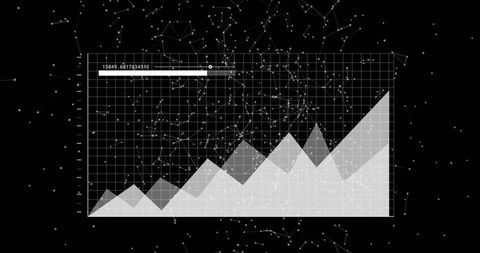
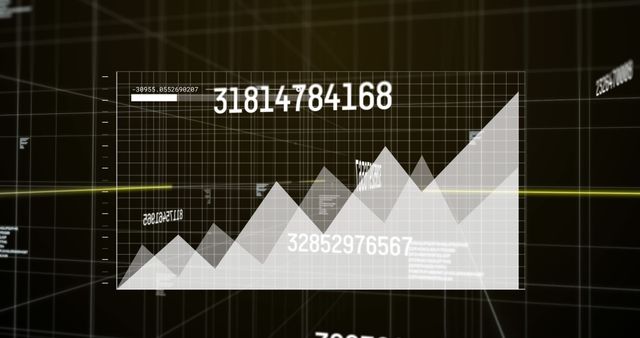
- Financial Data Analysis with Graph on Black Background
Financial Data Analysis with Graph on Black Background Image

Graph displaying growing financial trend stands out sharply against black background, symbolizing modern financial analysis and strategic forecasting. Great for materials on market research reports, investment strategies, or infographics related to economic growth and performance.

downloads
Tags:
More
Credit Photo
If you would like to credit the Photo, here are some ways you can do so
Text Link
photo Link
<span class="text-link">
<span>
<a target="_blank" href=https://pikwizard.com/photo/financial-data-analysis-with-graph-on-black-background/f3b7ebee61cfad89a3ab553458743a06/>PikWizard</a>
</span>
</span>
<span class="image-link">
<span
style="margin: 0 0 20px 0; display: inline-block; vertical-align: middle; width: 100%;"
>
<a
target="_blank"
href="https://pikwizard.com/photo/financial-data-analysis-with-graph-on-black-background/f3b7ebee61cfad89a3ab553458743a06/"
style="text-decoration: none; font-size: 10px; margin: 0;"
>
<img src="https://pikwizard.com/pw/medium/f3b7ebee61cfad89a3ab553458743a06.jpg" style="margin: 0; width: 100%;" alt="" />
<p style="font-size: 12px; margin: 0;">PikWizard</p>
</a>
</span>
</span>
Free (free of charge)
Free for personal and commercial use.
Author: Awesome Content